


-
- پلتفرمهای معاملاتی
- اپلیکیشن PU Prime
- MetaTrader 5
- MetaTrader 4
- PU Copy Trading
- تاجر وب
- پی یو سوشل


FA
26 December 2023,05:57
Daily Market Analysis
26 December 2023, 05:57


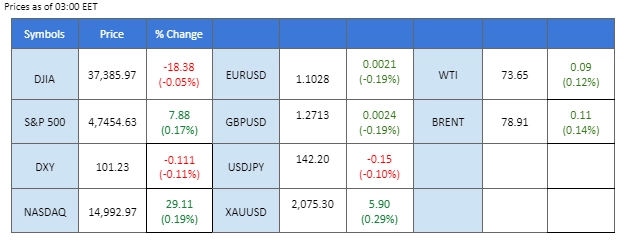
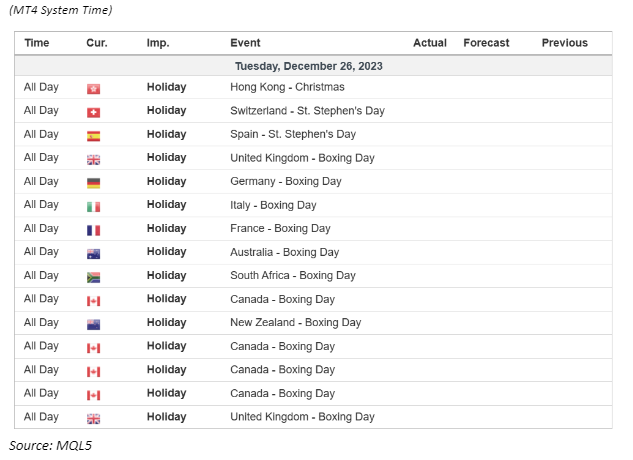
As Christmas and Boxing Day festivities take centre stage globally, financial markets are characterised by a tranquil opening to the week. Major currencies, including the dollar, have maintained stability in their price levels. However, anticipations are high that the strength of the dollar will encounter downward pressure when markets resume after the holidays. This projection follows the cementation of speculation surrounding the Federal Reserve’s dovish tilt, fueled by last week’s release of lower-than-expected economic data. In contrast, the bullish momentum in the U.S. equity market is poised to persist. The dovish speculation, coupled with the traditional Santa Claus rally—a seasonal trend noted at the beginning of the new year—may act as dual catalysts, potentially stimulating higher trading activity in the financial markets.
Current rate hike bets on 31 January Fed interest rate decision:
Source: CME Fedwatch Tool
0 bps (83.5%) VS -25 bps (16.5%)
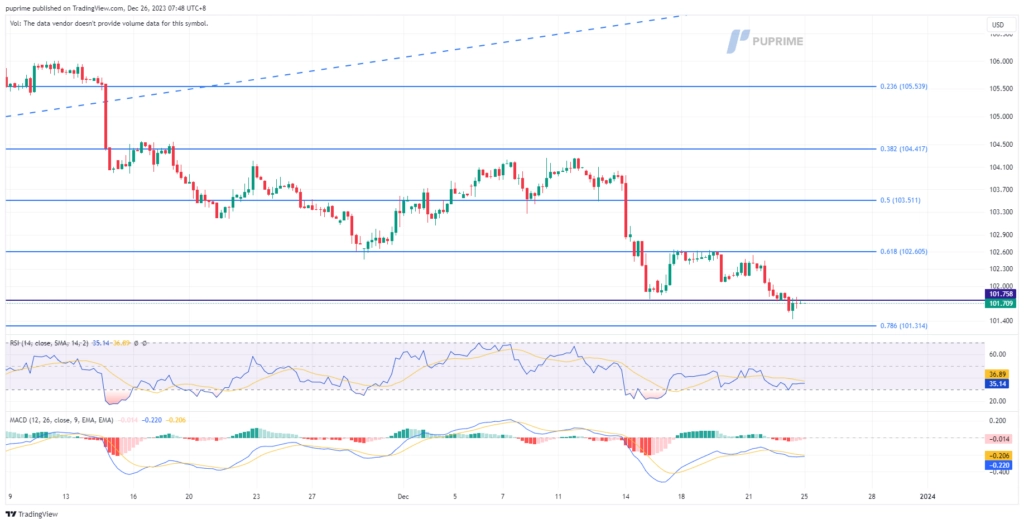
The US Dollar index exhibited minimal change yesterday, with an extended sideways trend anticipated to persist, particularly as many countries observe Boxing Day today. However, when financial markets resume after the holiday, the US Dollar is expected to face downward pressure. This projection stems from the widespread expectation among traders that the Federal Reserve will adopt a dovish stance, as indicated by recent market sentiment.
The Dollar Index is struggling to find support from its bearish trend and is heading to its lowest level since July. The RSI continues to flow near the oversold zone, while the MACD hovering below the zero line suggests the bearish momentum remains.
Resistance level: 102.60, 103.50
Support level: 101.30, 100.80
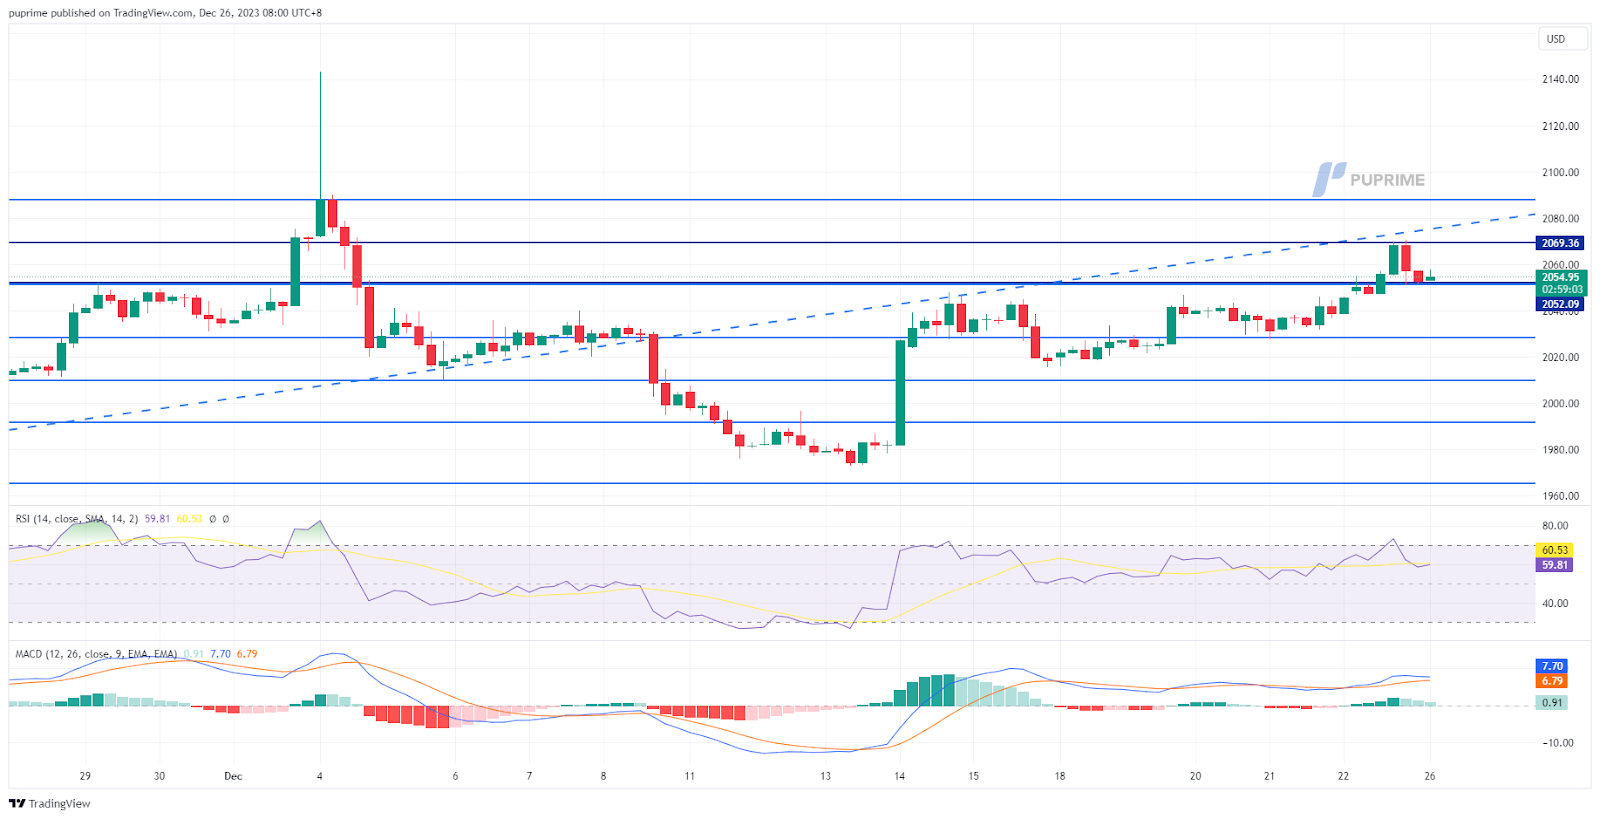
Gold prices exhibited a sideways trend during the initial two-day holiday of the week. As financial markets gear up to resume post-holidays, expectations point towards a potential upward movement in gold prices. This anticipation is fueled by the hindered strength of the dollar, attributed to speculation surrounding the Federal Reserve’s dovish stance. The ongoing unease in the Middle East also introduces another catalyst, potentially propelling higher safe-haven gold prices.
Gold prices seek a catalyst to rebound from its short-term technical retracement. The RSI remains flowing near the overbought zone, while the MACD flowing above the zero line suggests the bullish momentum remains.
Resistance level: 2069.35, 2088.10
Support level: 2028.50, 2010.00
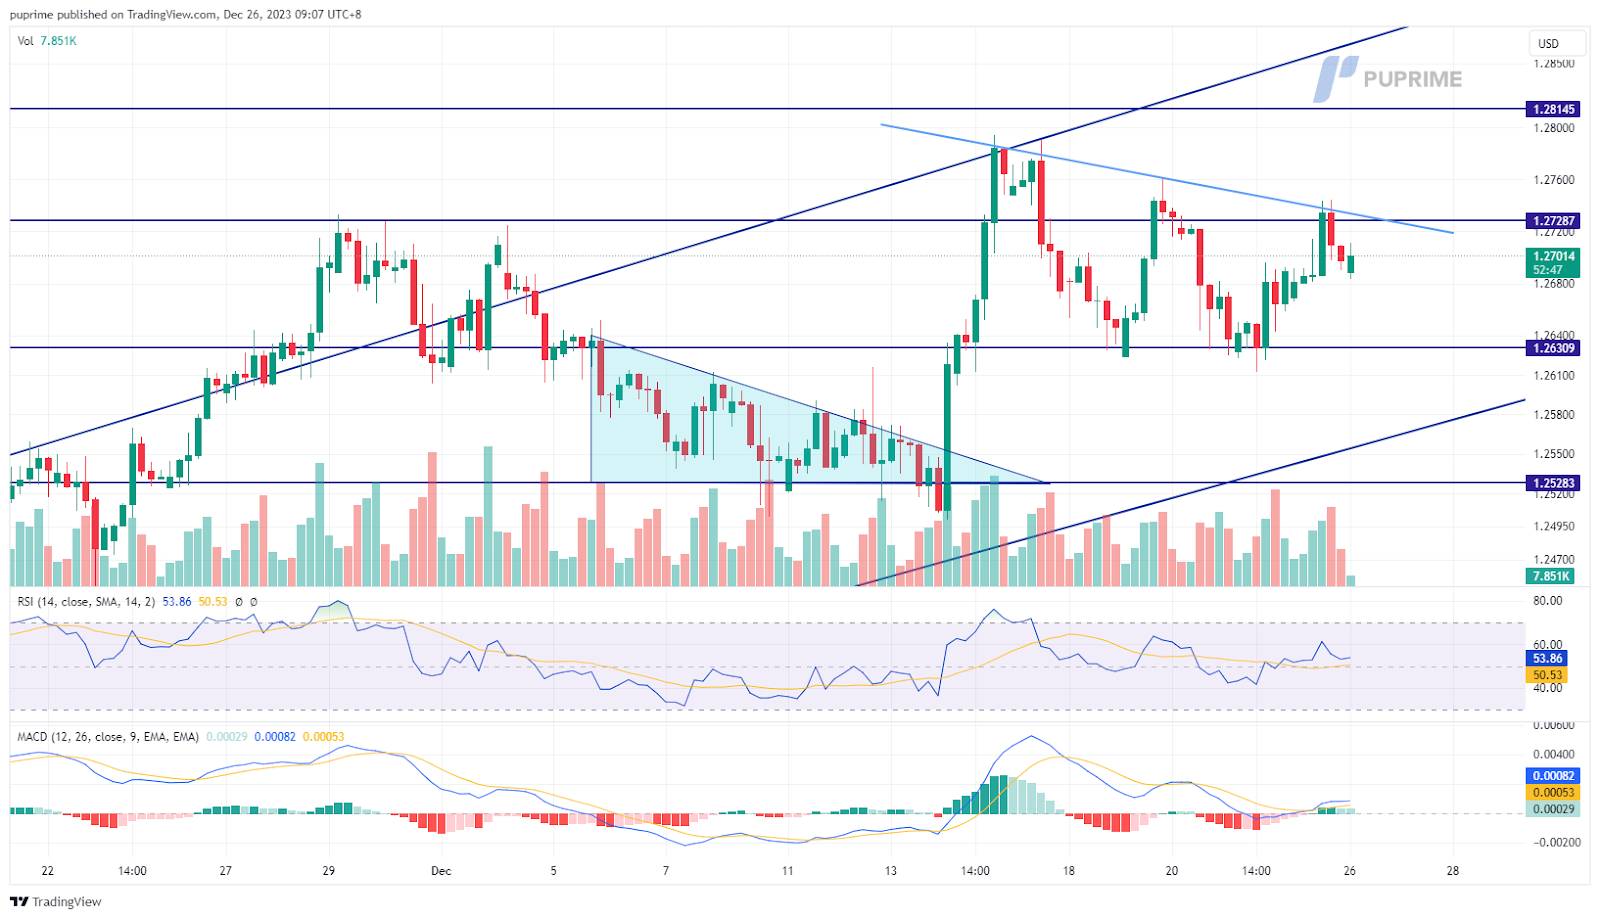
Despite posting marginal gains yesterday, the GBP/USD pair continues to trade below its short-term downtrend resistance level. This persistence is noteworthy, given weaker economic data from the U.S. last week. However, the Pound Sterling faces headwinds due to the UK’s own economic challenges, including a lower Consumer Price Index (CPI) reading and a softening Gross Domestic Product (GDP).
The GBP/USD pair has formed a lower high price pattern, suggesting a bearish bias for the pair. The RSI flowing near the overbought zone while the MACD hovering closely to the zero line suggest that the bullish monument has vanished.
Resistance level: 1.2729, 1.2815
Support level: 1.2630, 1.2528
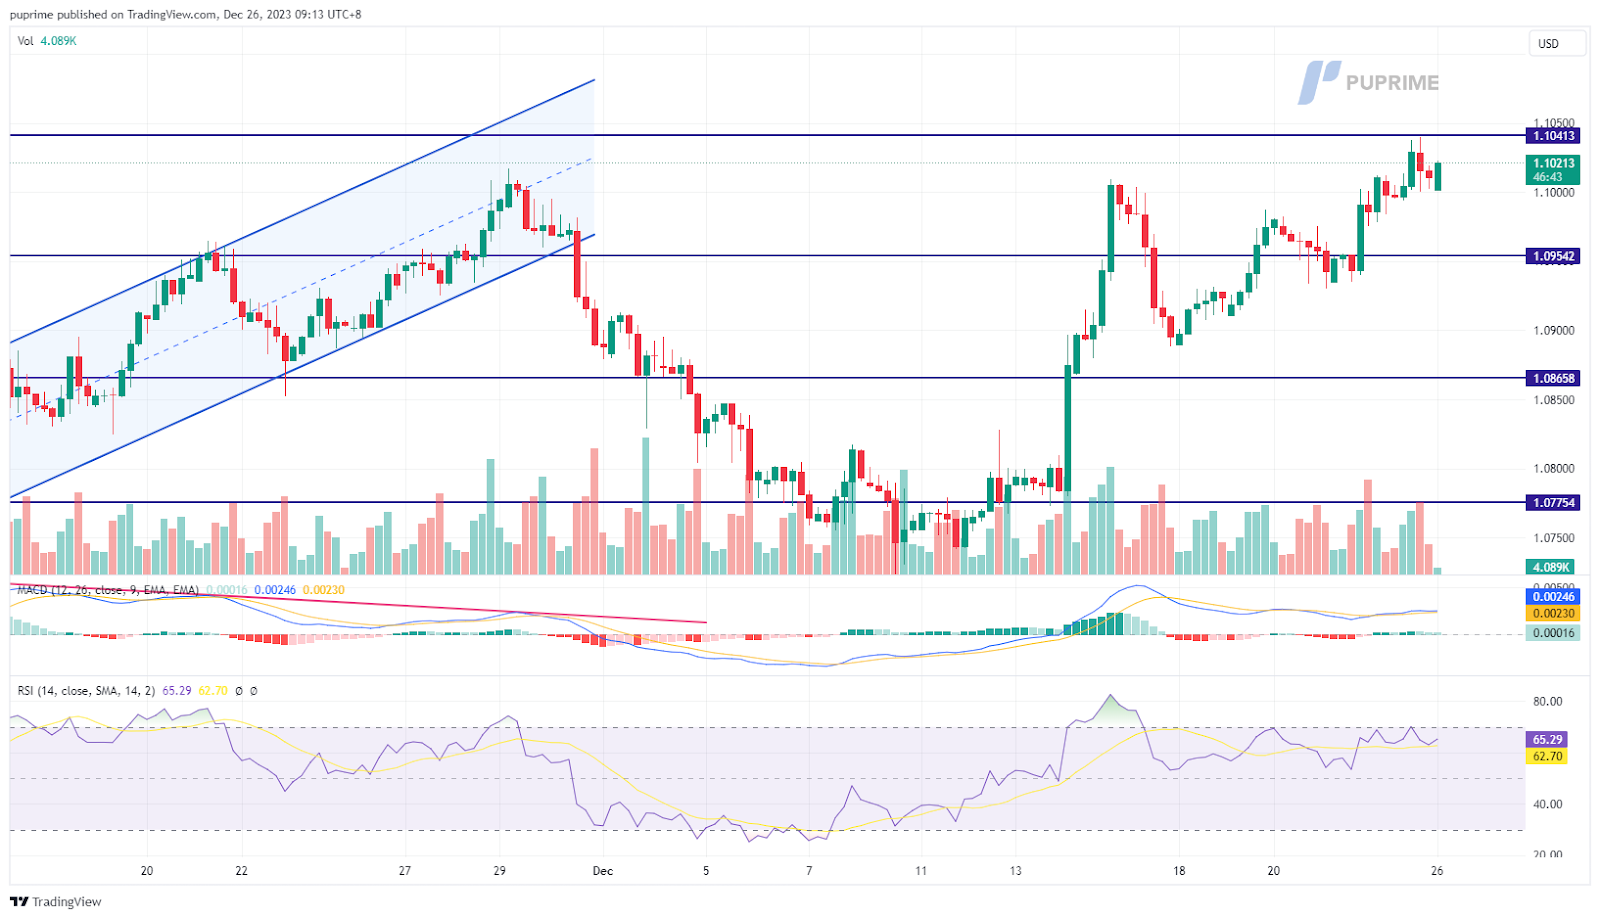
The EUR/USD pair has been trading at its highest level since mid-August, defying expectations of a dovish turn from the Federal Reserve. The European Central Bank (ECB) has maintained a hawkish stance, despite the Euro’s Consumer Price Index (CPI) remaining subdued at 2.4%, down from the previous reading of 2.9%. This persistence in the ECB’s hawkish tone, combined with the prevailing strong downward pressure on the dollar’s strength, suggests that the pair may continue its upward trajectory.
The EUR/USD remains trading with its uptrend trajectory and is testing its resistance level at 1.1041. The RSI remains flowing at an elevated level, while the MACD hovering above the zero line suggests the bullish momentum remains strong.
Resistance level: 1.1040, 1.1140
Support level: 1.0954, 1.0866
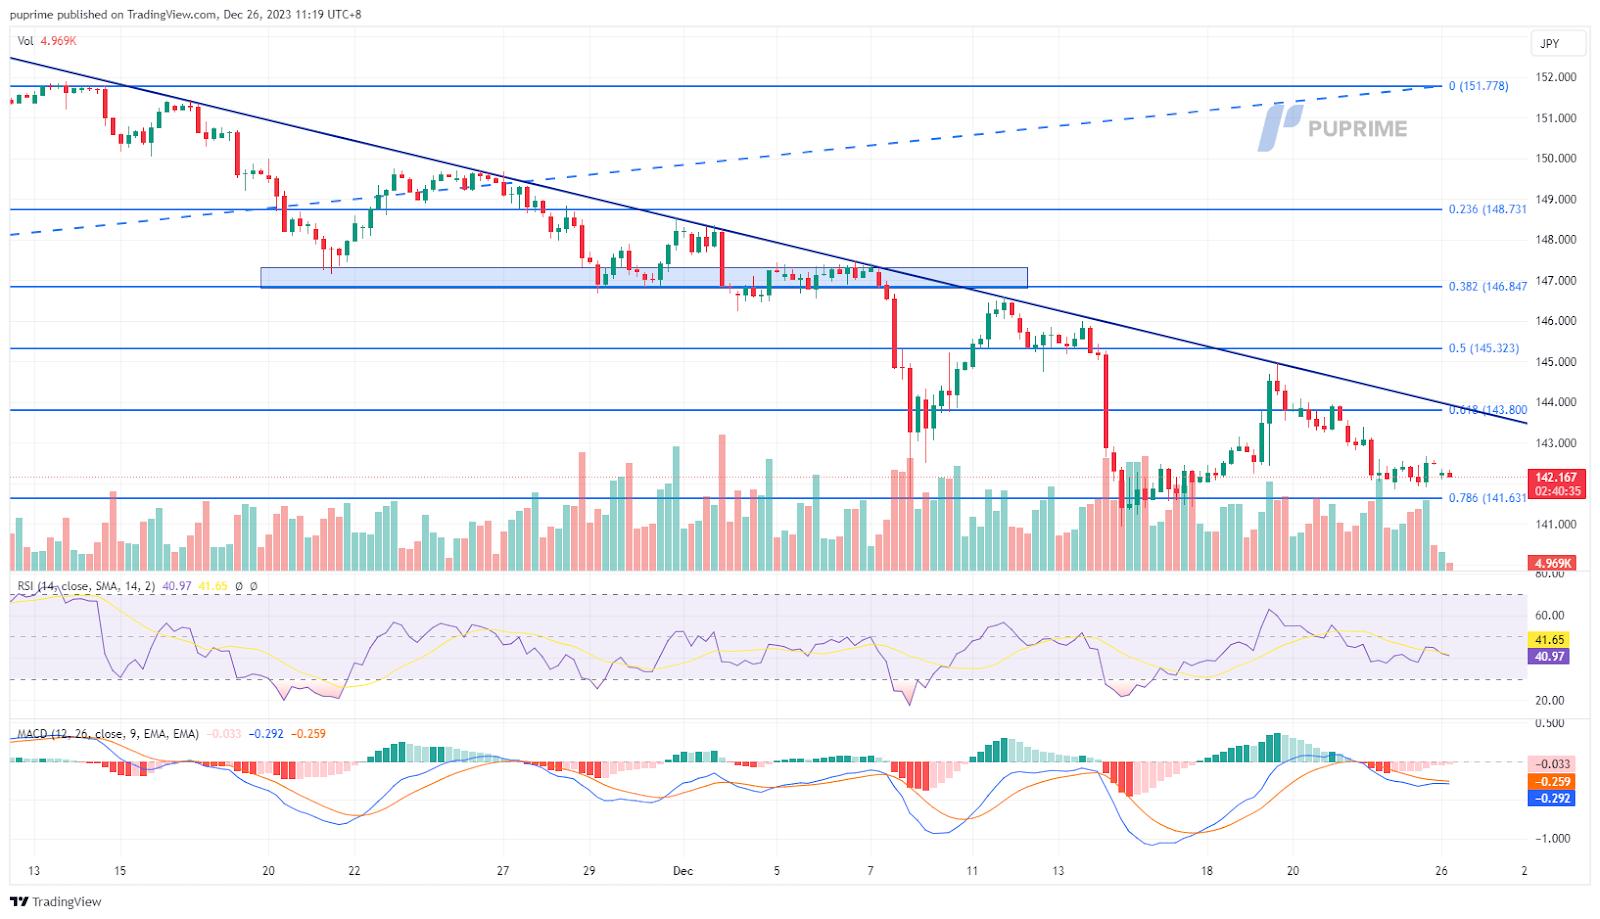
The Japanese yen has exhibited subdued trading against the U.S. dollar, remaining below its long-term downtrend resistance level. Market attention is now focused on the Bank of Japan (BoJ) Core Consumer Price Index (CPI) scheduled for release later today. A crucial indicator, a persistent reading above the BoJ’s targeted rate of 2% could strengthen the conviction that the BoJ is increasingly likely to shift from its ultra-loose monetary policy in the near future.
USD/JPY continues to trade in its long-term downtrend trajectory while is supported at its Fibonacci level of 78.6%; a break below such a level will be a solid bearish signal for the pair. The RSI has been hovering below the 50 level while the MACD failed to break above the zero line, suggesting the bearish momentum remains with the pair.
Resistance level: 143.78, 145.30
Support level: 141.60 138.88
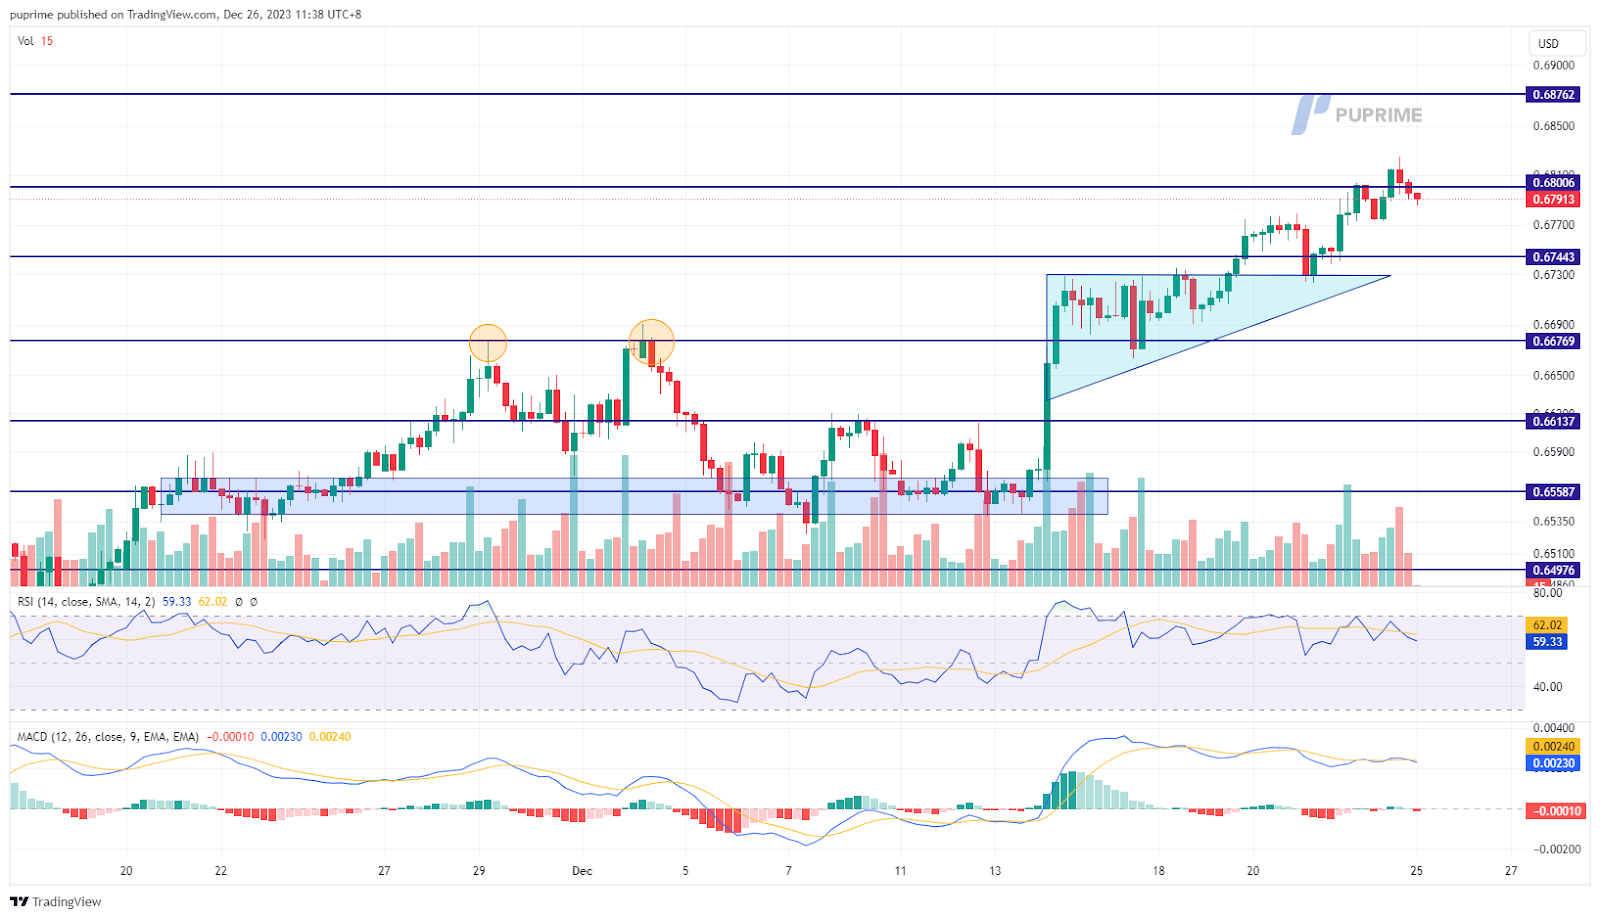
The Australian dollar continues to exhibit strength against the U.S. dollar, presently trading at its highest level in five months. The China Loan Prime Rate’s sustained low levels, aimed at stimulating the Chinese economy, contribute to the robust performance of the Australian dollar, often considered a proxy for China’s economic health. Traders are closely monitoring the upcoming U.S. job data later this week, anticipating its impact on the price movement of the AUD/USD pair.
The AUD/USD pair broke above the triangle price pattern and later formed a higher high price pattern, suggesting a bullish bias. The RSI as well as the MACD both flowing at high level, suggest the bullish momentum remains strong.
Resistance level: 0.6876, 0.6946
Support level: 0.6744, 0.6677
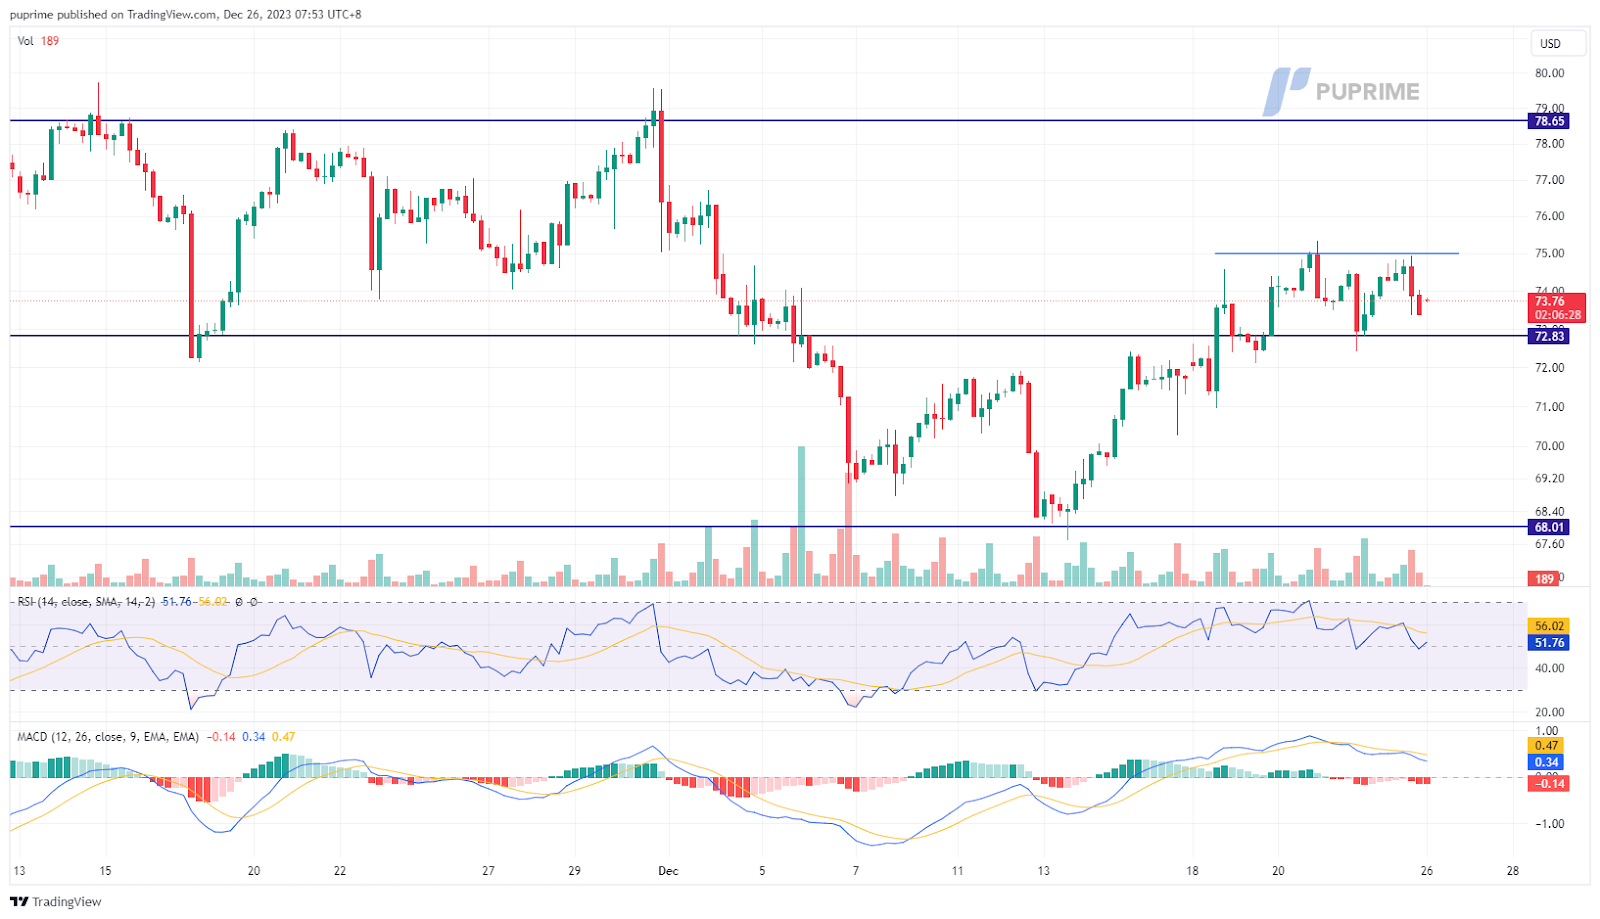
Oil prices have shown signs of stabilisation following Angola’s departure from OPEC. However, a robust downward pressure persists as oil shipments through the Red Sea are set to resume. A multinational maritime task force has effectively safeguarded vessels from Houthi rebel attacks in Yemen, resolving the short-term supply disruption. The impending resumption of oil supplies introduces the potential for further declines in oil prices.
A short-term resistance level suppresses oil prices and has formed a double-top price pattern suggesting a bearish bias. The RSI gradually moves lower while the MACD approaches the zero line from above, suggesting a bearish momentum is forming.
Resistance level: 75.35, 78.65
Support level: 773.20, 69.95

Trade forex, indices, metal, and more at industry-low spreads and lightning-fast execution.
ہمارے پریشانی مفت عمل کے ساتھ PU پرائم لائیو اکاؤنٹ کے لئے سائن اپ کریں.
بغیر کسی تکلیف کے اپنے اکاؤنٹ کو وسیع چینلز اور قبول شدہ کرنسیوں کے ذریعے فنڈ کریں۔
مارکیٹ لیڈنگ ٹریڈنگ حالات کے تحت سینٹوں کی تعداد تک رسائی حاصل کریں.
پلتفرمهای معاملاتی
یادگیری
درباره PU Prime
شرکتی