


-
- پلتفرمهای معاملاتی
- اپلیکیشن PU Prime
- MetaTrader 5
- MetaTrader 4
- PU Copy Trading
- تاجر وب
- پی یو سوشل


FA
15 January 2024,05:56
Daily Market Analysis
15 January 2024, 05:56


The Dollar Index remains range-bound near resistance, with conflicting signals from the U.S. – robust economic performance juxtaposed with dovish Federal Reserve statements, obscuring its trajectory. Despite a U.S. holiday pausing equity trading today, focus intensifies on upcoming key economic data, including retail sales and industrial productions, along with statements from Fed officials and notable bank earnings. The week promises a comprehensive outlook with China’s 2023 full-year GDP release adding to the mix. Meanwhile, gold surges amid geopolitical unrest triggered by U.S. and U.K. strikes on Yemen, bolstering its safe-haven appeal.
Current rate hike bets on 31 January Fed interest rate decision:
Source: CME Fedwatch Tool
0 bps (95%) VS -25 bps (5%)

(MT4 System Time)

Source: MQL5
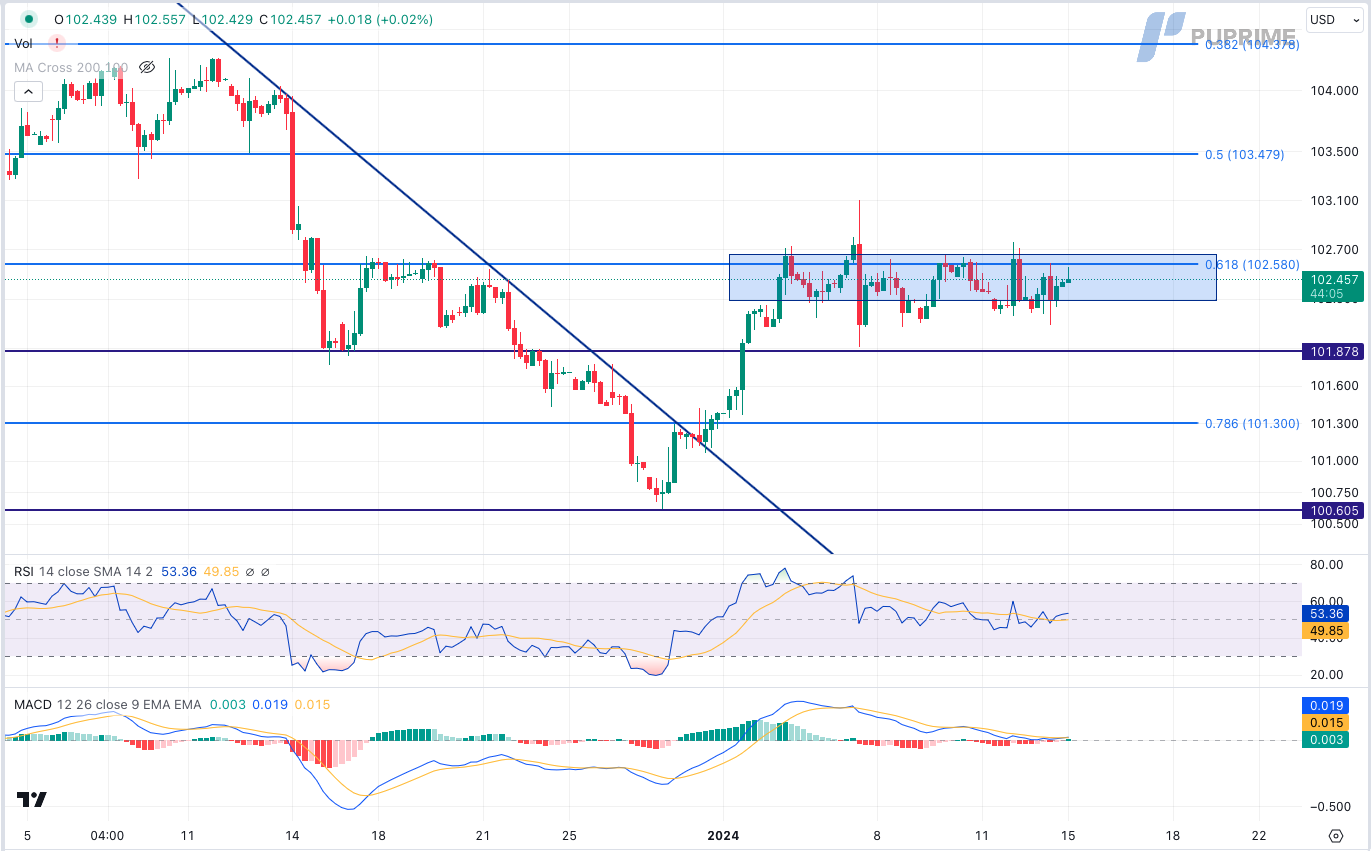
The Dollar Index, tracking against major currencies, remains in consolidation near resistance. The conflicting signals from the U.S., featuring robust economic performances alongside dovish Federal Reserve statements, have obscured the Dollar’s trajectory. In the spotlight this week, retail sales data and bank earnings are anticipated to provide insights into the health of U.S. consumers.
The Dollar Index is trading flat while currently testing the resistance level. MACD has illustrated increasing bullish momentum, while RSI is at 54, suggesting the index might extend its gains after breakout since the RSI stays above the midline.
Resistance level: 102.60, 103.45
Support level: 101.90, 101.30
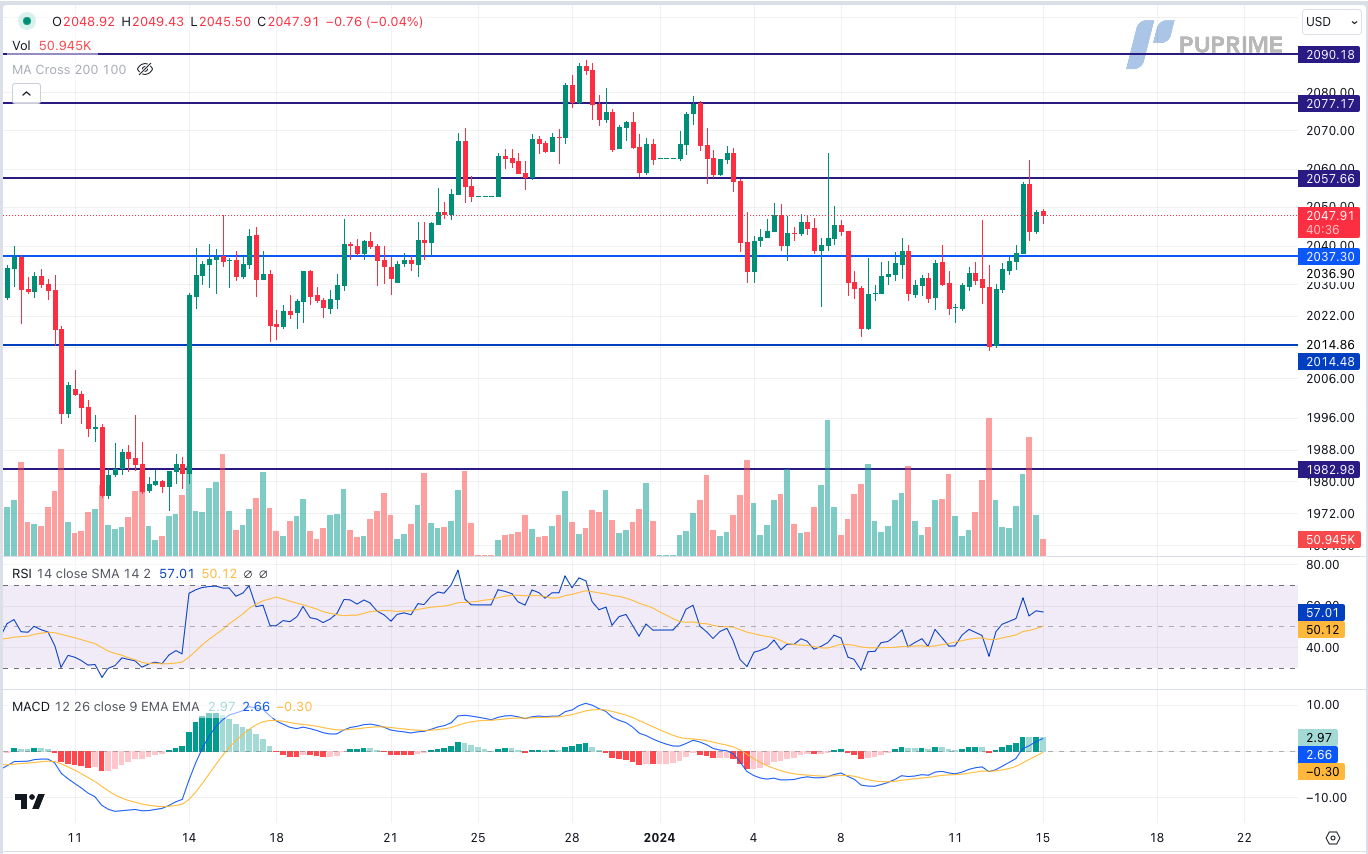
Gold prices experienced a significant surge amid escalating geopolitical tensions, particularly fueled by U.S. and U.K. strikes on Yemen. The military actions against Iran-aligned Houthi rebels heightened global tensions, boosting the safe-haven appeal of gold. Despite upbeat U.S. economic data, expectations of a dovish stance from the Federal Reserve continue to enhance gold’s attractiveness.
Gold prices are trading higher following the prior breakout above the resistance level. MACD has illustrated increasing bullish momentum, while RSI is at 57, suggesting the commodity might extend its gains after breakout since the RSI stays above the midline.
Resistance level: 2055.00, 2075.00
Support level: 2035.00, 2015.00
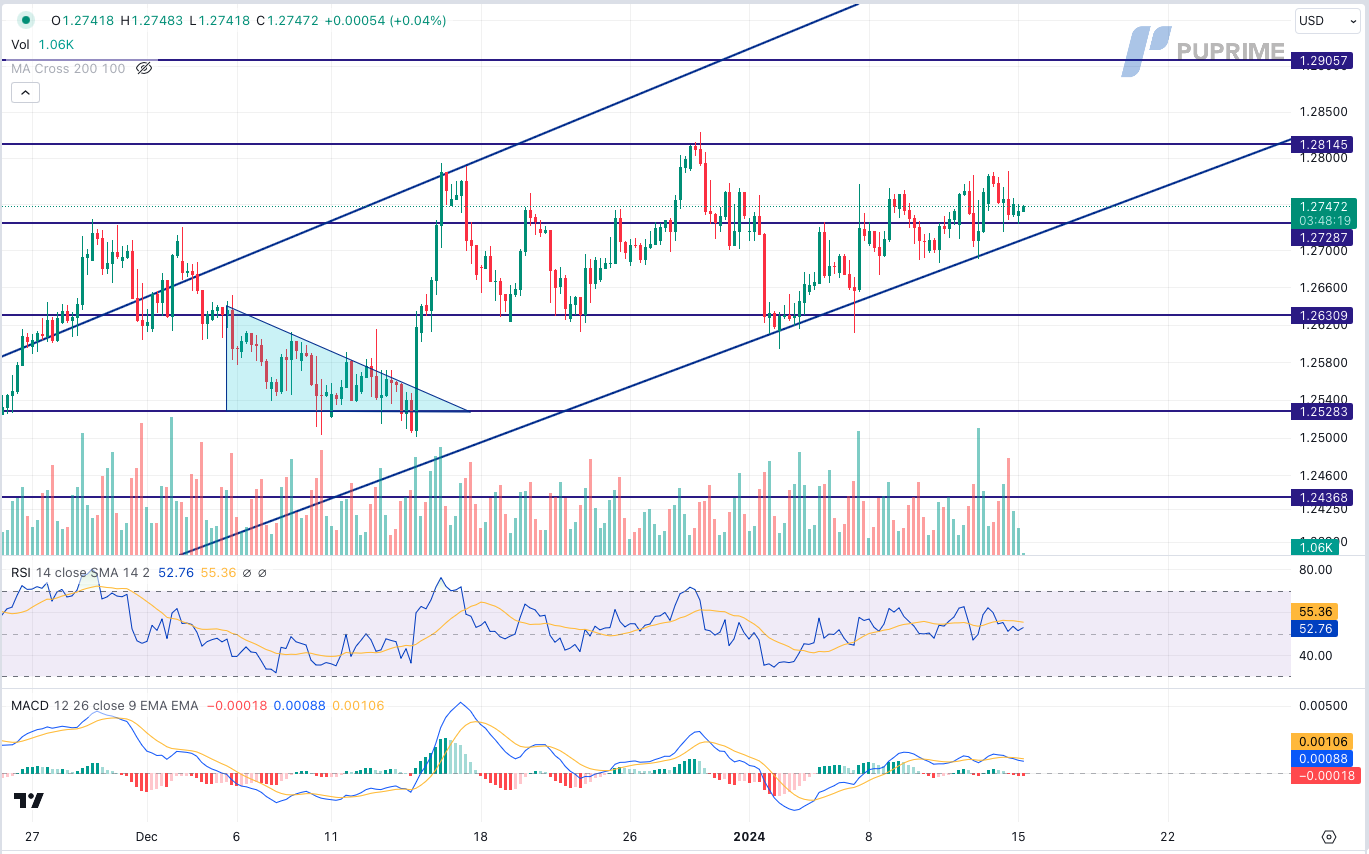
The Pound Sterling maintains its positive trajectory, with investors closely eyeing the upcoming UK inflation report for vital trading signals. Economists anticipate inflation to remain above the 2% Bank of England target. In contrast to some major central banks, the Bank of England stands firm with a hawkish tone, signalling a commitment to keeping interest rates elevated for an extended period. This stance is aimed at preventing potential long-term economic issues stemming from the inflation surge.
GBP/USD is trading higher following the prior rebound from the support level. MACD has illustrated diminishing bearish momentum, while RSI is at 53, suggesting the pair might extend its gains since the RSI stays above the midline.
Resistance level: 1.2815, 1.2905
Support level: 1.2728, 1.2630
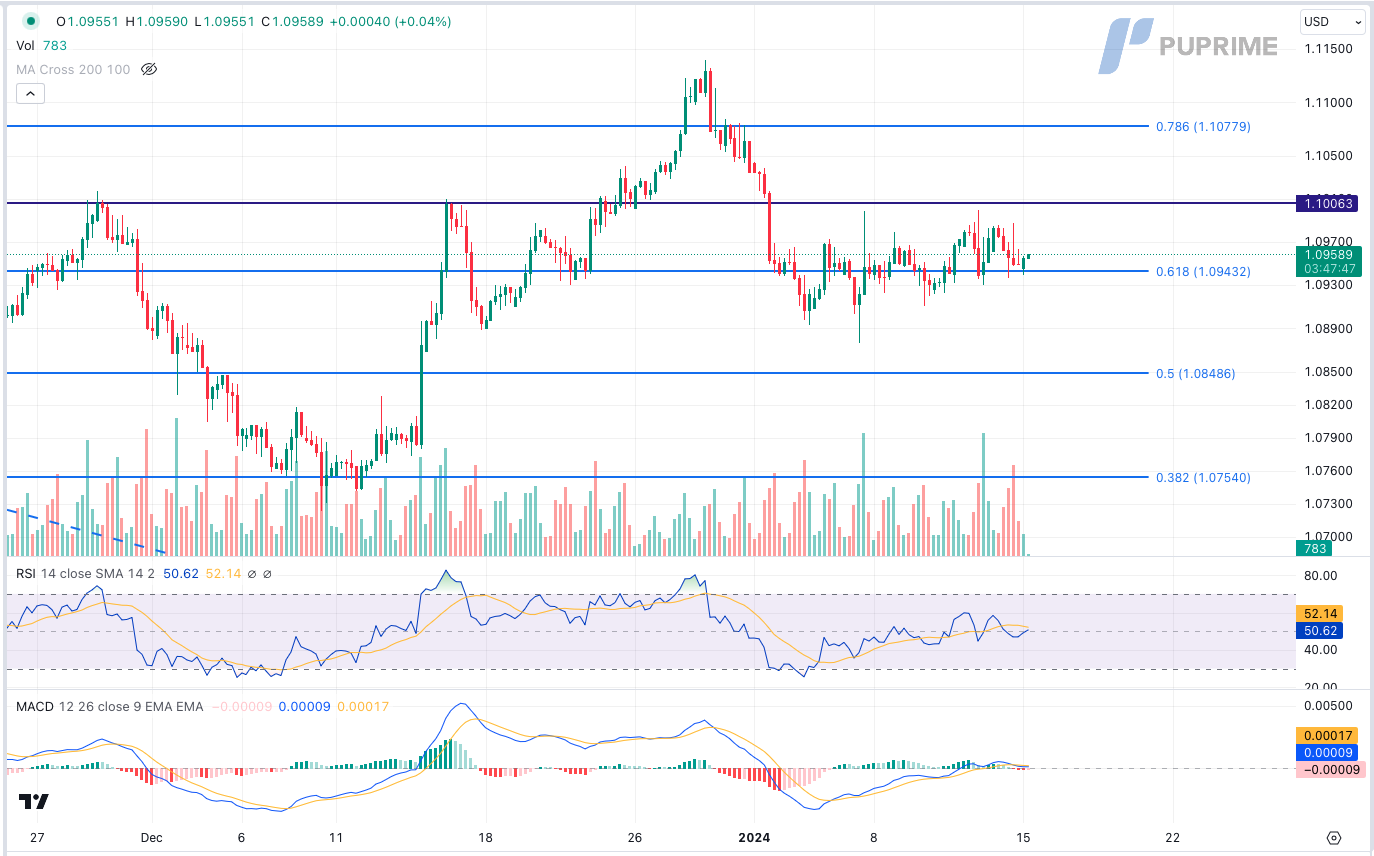
Amid a lack of market catalysts from the Eurozone, the Euro’s movement remains subdued. European Central Bank (ECB) officials acknowledge a controlled economic slowdown but emphasise uncertainty for 2024. The ECB notes that incoming data reveals an uncertain future with a downside bias. This uncertainty prompts investors to adopt a cautious stance, leading to Euro sell-offs as they await further clarification on the region’s economic outlook.
EUR/USD is trading lower while currently testing the support level. MACD has illustrated increasing bearish momentum, while RSI is at 51, suggesting the pair might continue to consolidate near the support level since the RSI near the midline.
Resistance level: 1.1005, 1.1080
Support level: 1.0945, 1.0850
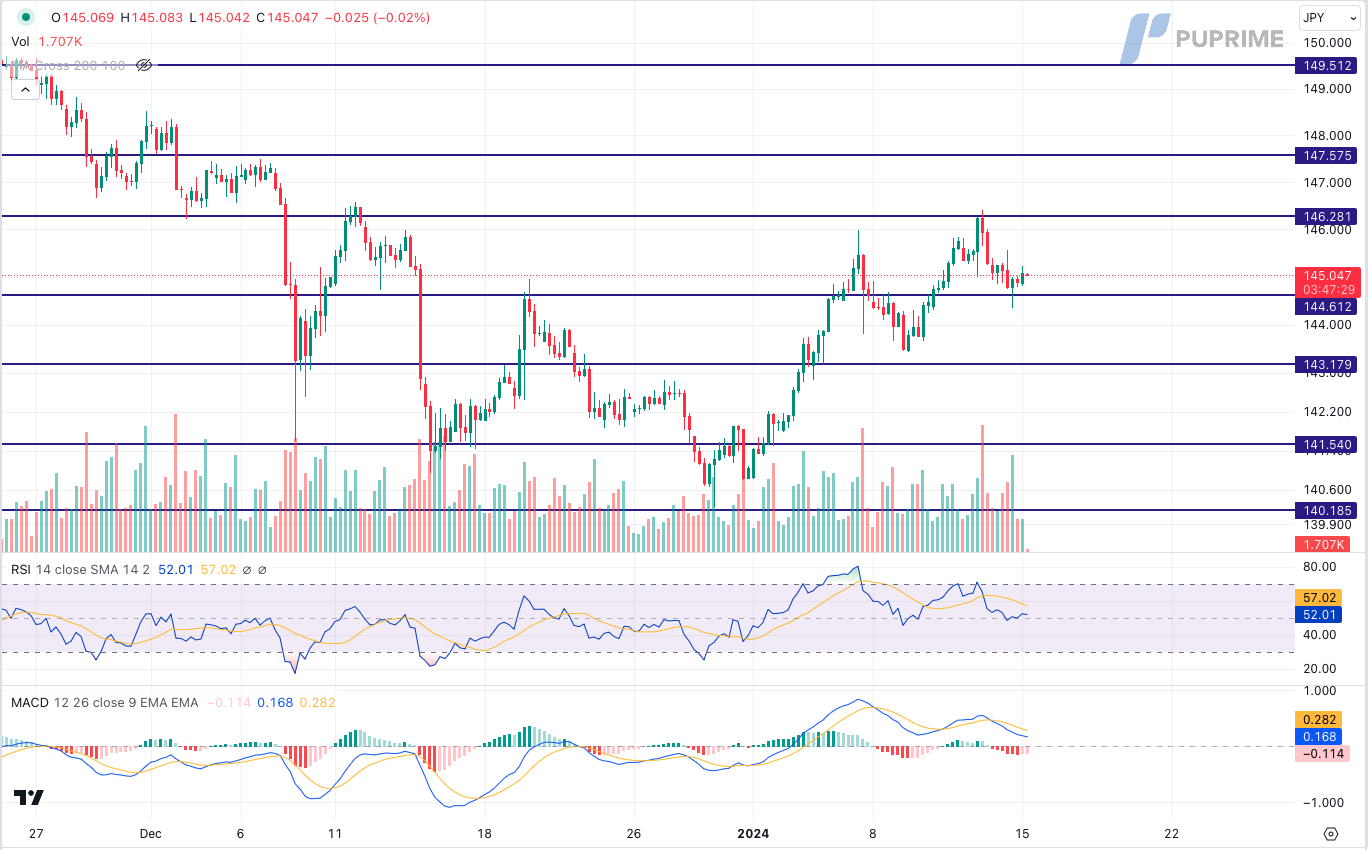
USD/JPY continues its descent, hovering around the support level of 144.60. The primary catalyst behind this decline is the tightening US-Japan treasury yields. With expectations of a potentially more dovish Federal Reserve in 2024, with economists forecasting a 150 basis points rate cut, investors opt to offload USD/JPY positions, concluding carry trades initiated earlier.
USD/JPY is trading lower while currently testing the support level. MACD has illustrated diminishing bearish momentum, while RSI is at 52, suggesting the pair might experience technical correction since the RSI stays above the midline
Resistance level: 146.30, 147.55
Support level: 144.60, 143.20
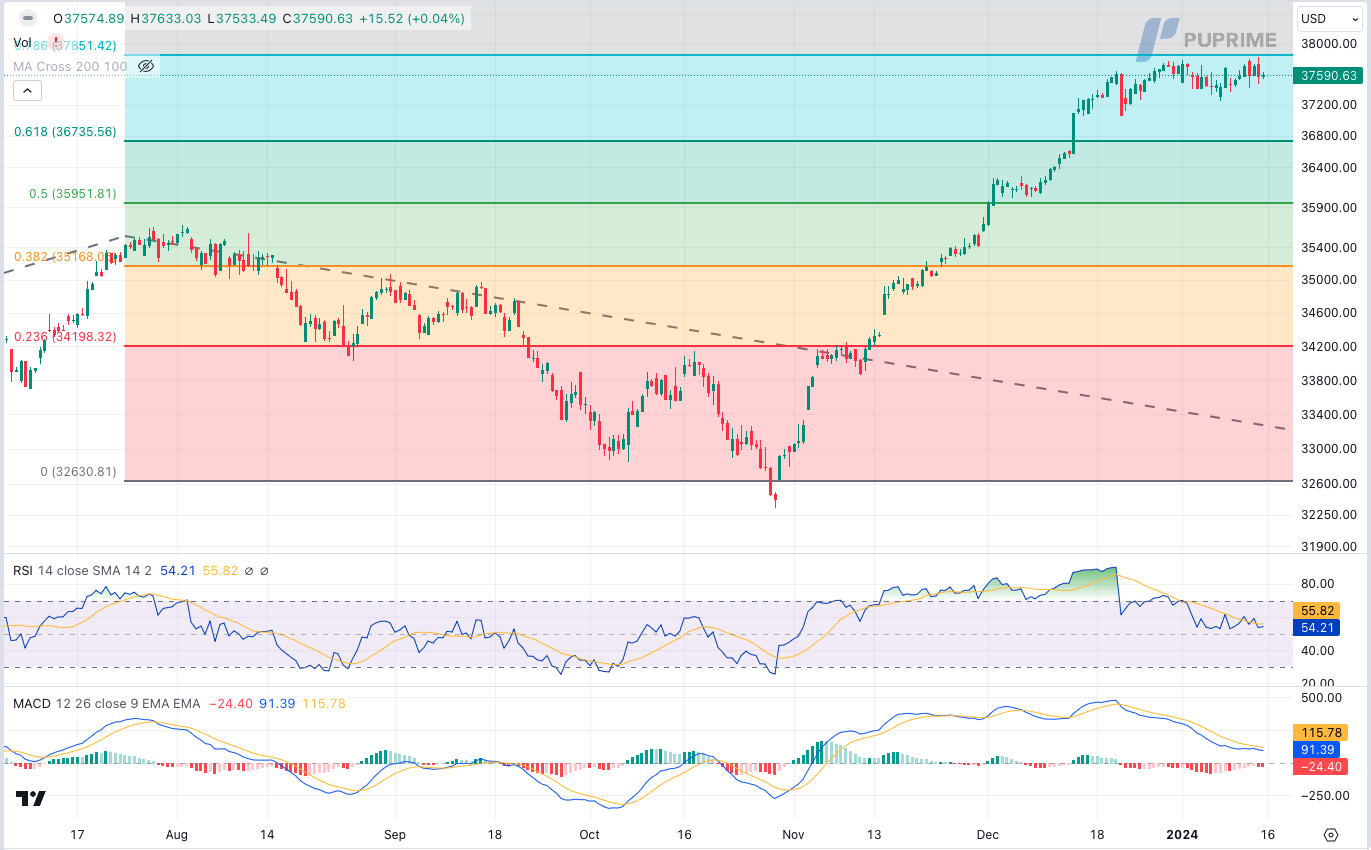
With today being a U.S. holiday, equity markets observe closures. However, anticipation builds for the week ahead, featuring pivotal events such as retail sales data, industrial productions, and statements from Fed officials. The ongoing earnings season, highlighted by major banks like Morgan Stanley and Goldman Sachs, adds further depth to market developments.
The Dow is trading higher while currently testing the resistance level. However, MACD has illustrated increasing bearish momentum, while RSI is at 54, suggesting the index might experience technical correction since the RSI retreated sharply from overbought territory.
Resistance level: 37850.00, 39275.00
Support level: 36735.00, 35950.00
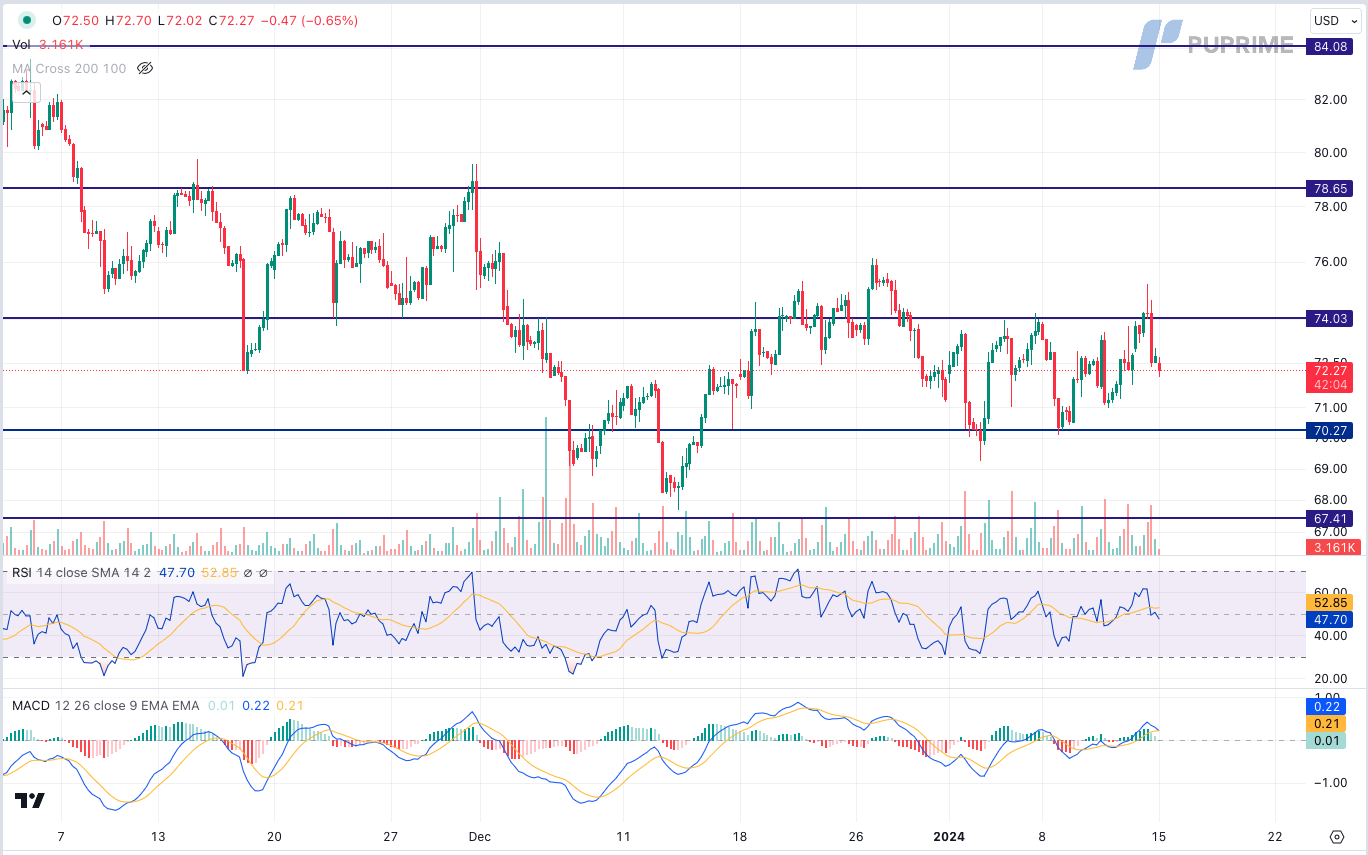
Oil prices initially rebounded as the U.S. and U.K. engaged in Yemen, intensifying geopolitical concerns and raising fears of supply disruptions. However, a subsequent retreat in oil prices reflects persistent worries about the global economic outlook. Looking forward, China’s release of full-year GDP figures will play a significant role in shaping market expectations for 2023.
Oil prices are trading lower following the prior retracement from the resistance level. MACD has illustrated diminishing bullish momentum, while RSI is at 48, suggesting the commodity might extend its losses since the RSI stays below the midline.
Resistance level: 74.00, 78.65
Support level: 67.40, 63.70

Trade forex, indices, metal, and more at industry-low spreads and lightning-fast execution.
ہمارے پریشانی مفت عمل کے ساتھ PU پرائم لائیو اکاؤنٹ کے لئے سائن اپ کریں.
بغیر کسی تکلیف کے اپنے اکاؤنٹ کو وسیع چینلز اور قبول شدہ کرنسیوں کے ذریعے فنڈ کریں۔
مارکیٹ لیڈنگ ٹریڈنگ حالات کے تحت سینٹوں کی تعداد تک رسائی حاصل کریں.
پلتفرمهای معاملاتی
یادگیری
درباره PU Prime
شرکتی