


-
- پلتفرمهای معاملاتی
- اپلیکیشن PU Prime
- MetaTrader 5
- MetaTrader 4
- PU Copy Trading
- تاجر وب
- پی یو سوشل


FA
15 March 2024,06:06
Daily Market AnalysisMarket Insights
15 March 2024, 06:06

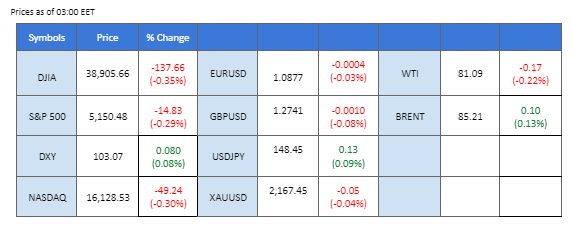
Amidst a flurry of economic data and speculation, the Dollar Index surged on the back of stronger-than-expected inflation figures, fueling expectations of impending interest rate hikes and bolstering US Treasury yields. Concurrently, crude oil prices maintained their upward momentum as the International Energy Agency forecasted a supply deficit for 2024, driven by improved economic performance and rising global demand. Gold prices, however, saw losses and consolidated around support levels, attributed to profit-taking strategies among investors awaiting further market catalysts. US equity markets retreated amid surging bond yields spurred by inflation concerns. Meanwhile, attention shifted to the Japanese yen amidst speculation surrounding the Bank of Japan’s potential policy shifts, with anticipation mounting for a potential rate hike in April.
Current rate hike bets on 20th March Fed interest rate decision:
Source: CME Fedwatch Tool
0 bps (95%) VS -25 bps (5%)
(MT4 System Time)
N/A
Source: MQL5
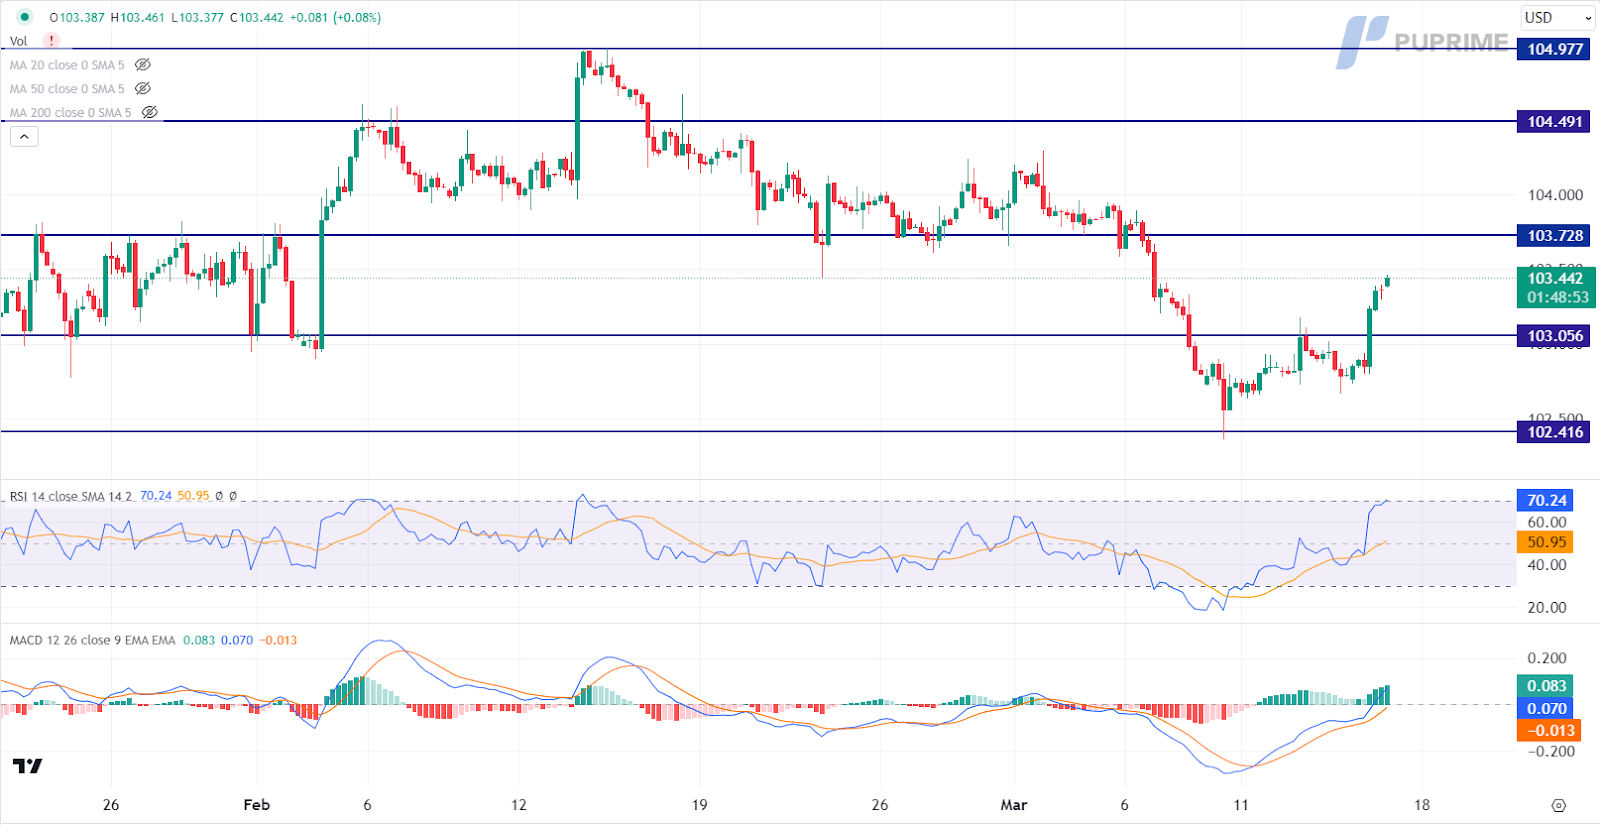
The Dollar Index, tracking the greenback against a basket of major currencies, rebounded on the heels of better-than-expected inflation figures. The robust data prompted heightened expectations of rising interest rates, leading to a resurgence in US Treasury yields. According to the US Bureau of Labor Statistics, the Producer Price Index (PPI) for the previous month saw a significant increase from 0.30% to 0.60%, surpassing market forecasts of 0.30%. Additionally, Initial Jobless Claims reported by the Department of Labor came in at 209K, better than the expected 218K, signalling continued strength in the labour market.
The Dollar Index is trading higher following the prior breakout above the previous resistance level. MACD has illustrated increasing bullish momentum. However, RSI is at 70, suggesting the index might enter overbought territory.
Resistance level: 103.75, 104.50
Support level:103.05, 102.40
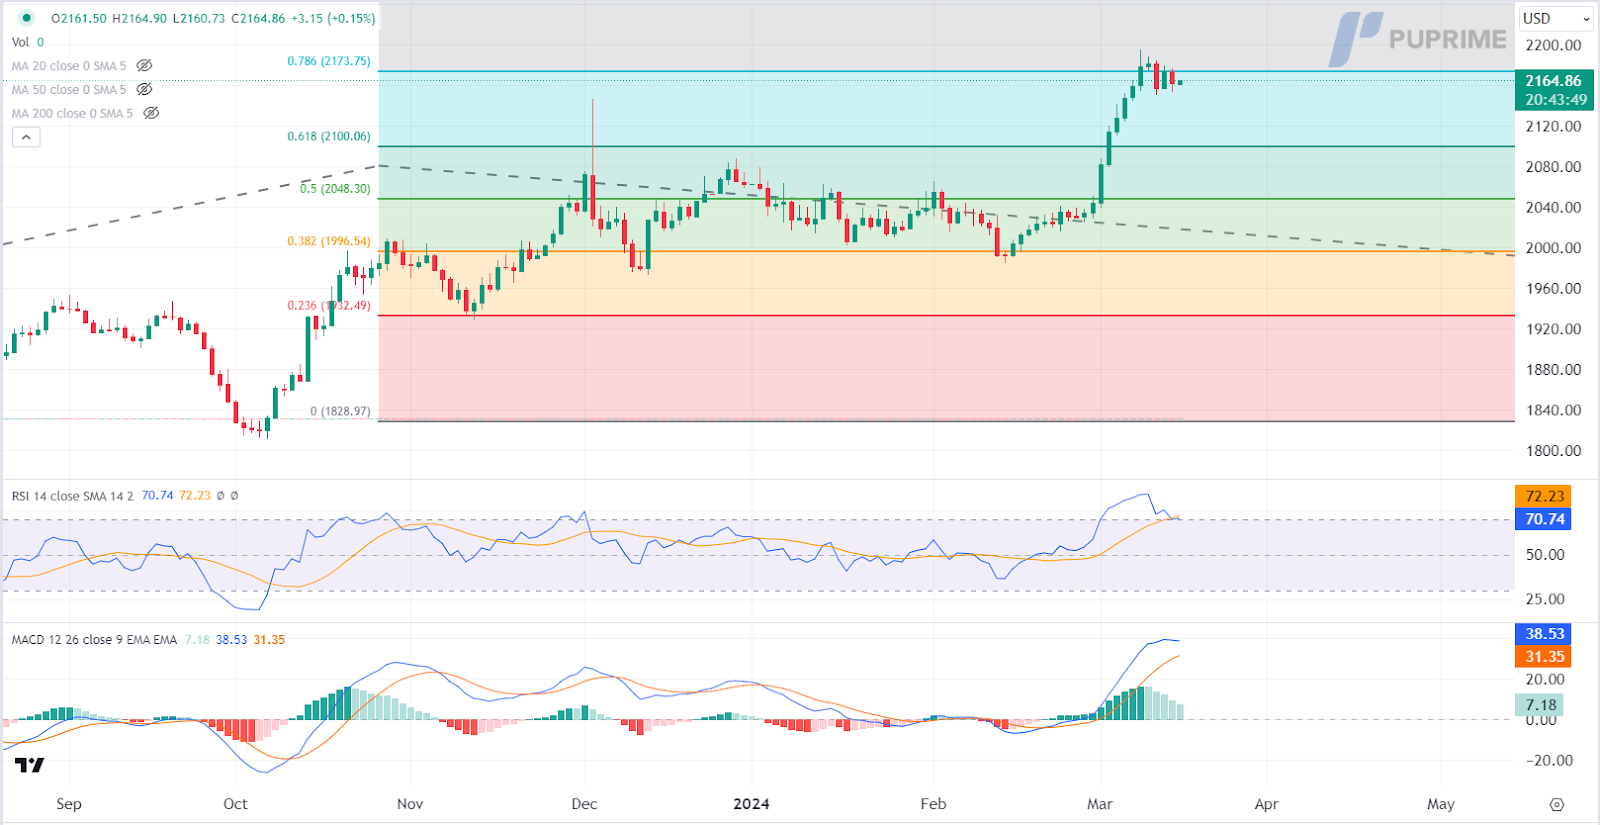
Gold prices extended losses and consolidated around after reaching record highs. Investors opted for profit-taking strategies while awaiting further catalysts before re-entering the market. Improved inflation data raised expectations for the Federal Reserve to delay rate cut policies, potentially impacting non-yielding commodities like gold.
Gold prices are trading lower following the prior retracement from the resistance level. MACD has illustrated diminishing bullish momentum, while RSI is at 71, suggesting the commodity might enter overbought territory.
Resistance level: 2175.00, 2265.00
Support level: 2100.00, 2050.00
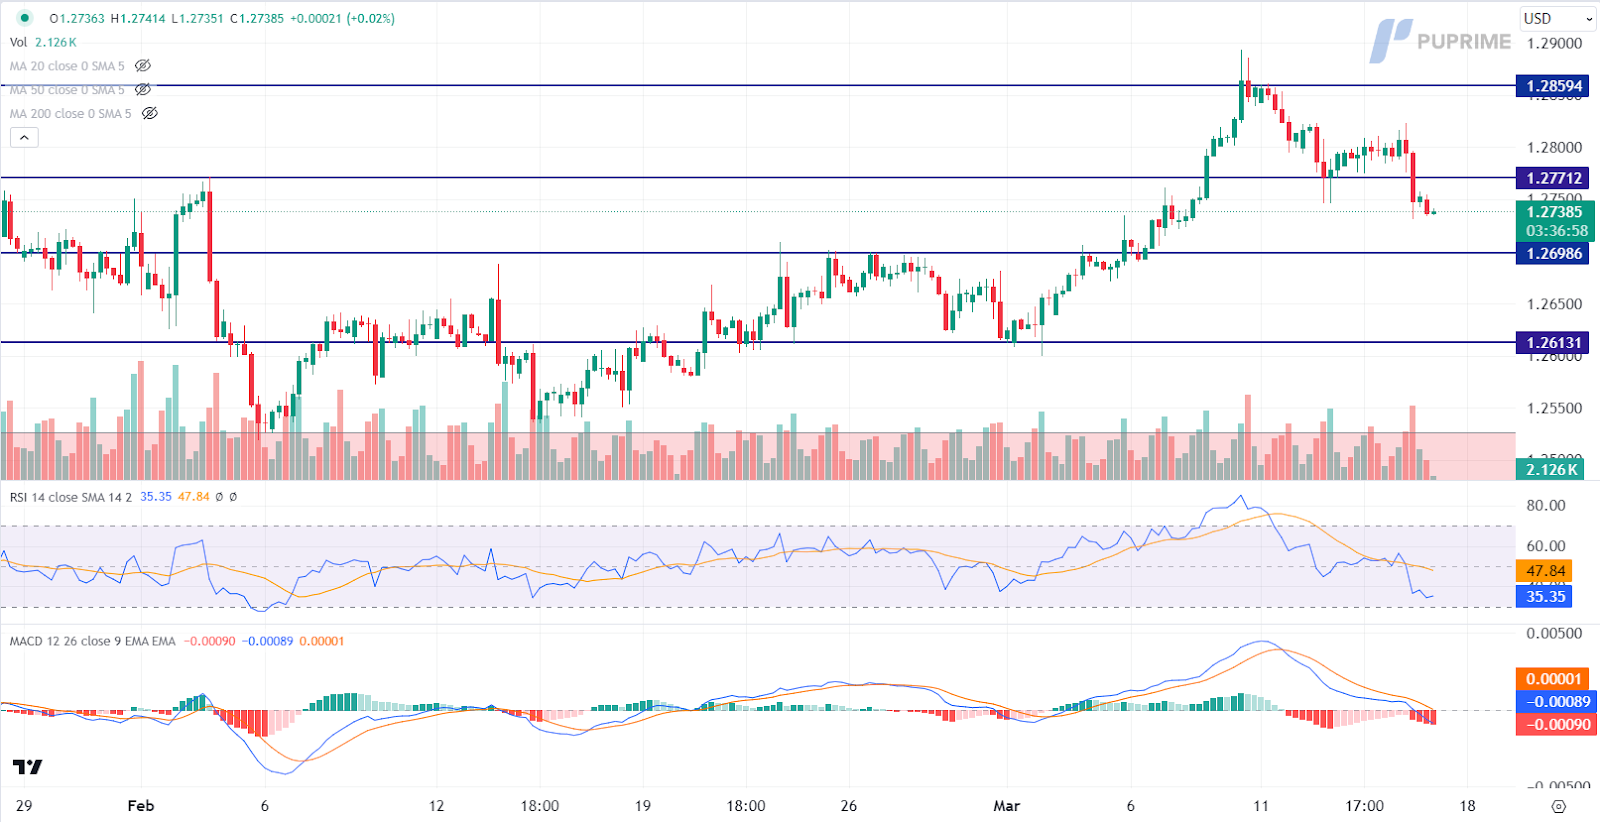
Lack of market catalysts from the UK region coupled with US Dollar appreciation prompted a bearish momentum for the GBP/USD pair. Strong US inflation data and high PPI figures dimmed expectations for Fed easing policies, contrasting with the UK’s economic rebound from recession, which pushed back expectations for a Bank of England rate cut.
GBP/USD is trading lower following the prior breakout below the previous support level. MACD has illustrated increasing bearish momentum, while RSI is at 35, suggesting the pair might extend its losses since the RSI stays below the midline.
Resistance level: 1.2770, 1.2860
Support level: 1.2700, 1.2615
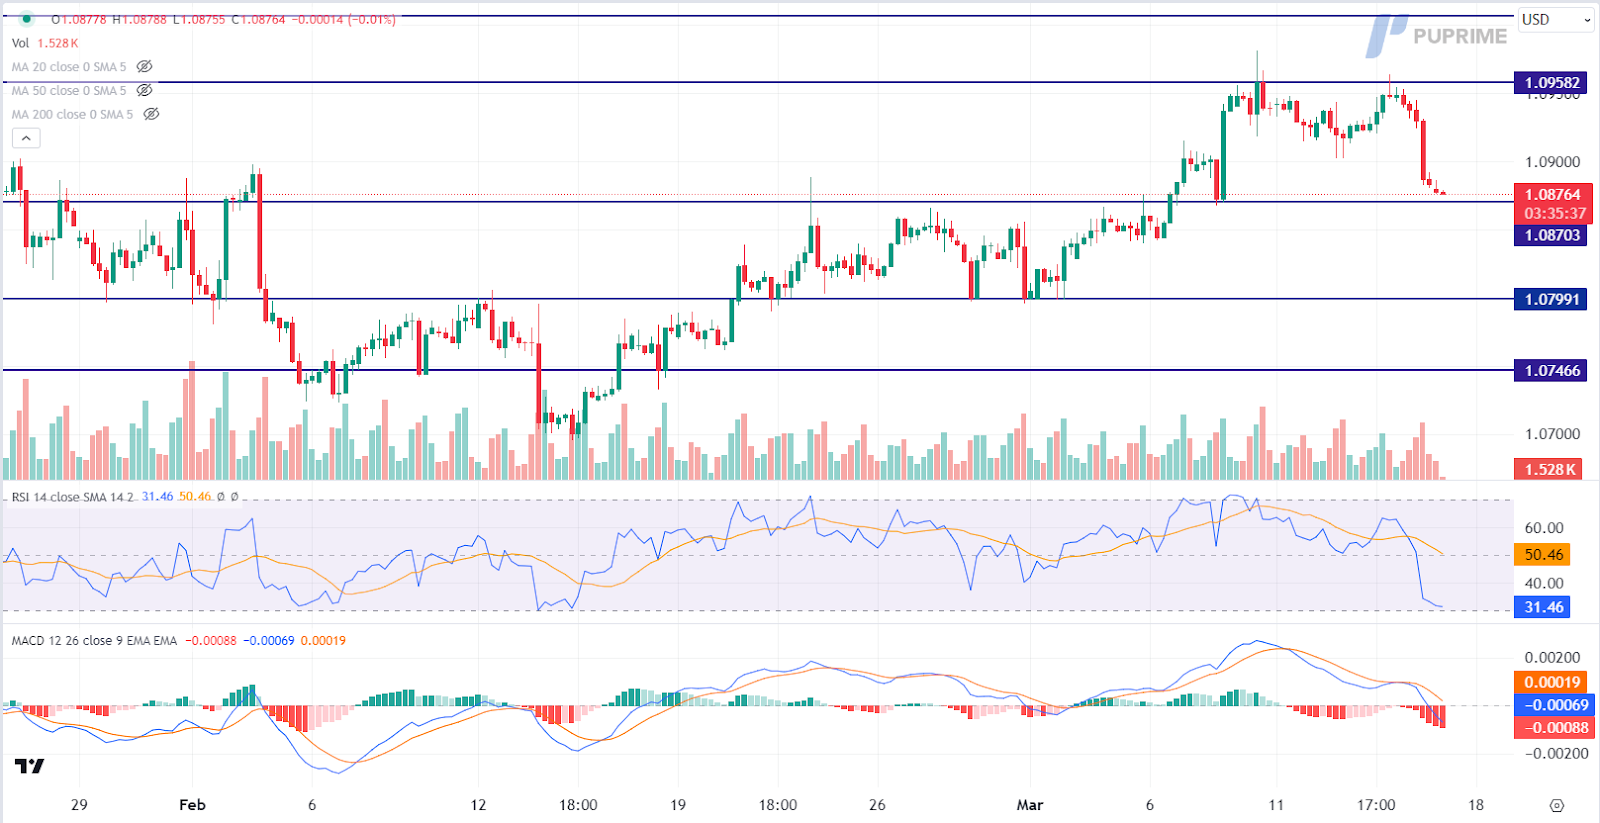
The EUR/USD pair sustained bearish momentum driven by US Dollar appreciation following stronger-than-expected inflation data. Diminished expectations for Fed interest rate cuts in the short term contrasted with upcoming ECB policy maker comments on monetary policy prospects in Europe. Investors monitored monetary statements for further trading signals amidst ongoing market volatility.
EUR/USD is trading lower while currently testing the support level. MACD has illustrated increasing bearish momentum, while RSI is at 31, suggesting the pair might extend its losses after breakout since the RSI stays below the midline.
Resistance level: 1.0960, 1.1005
Support level: 1.0870, 1.0800
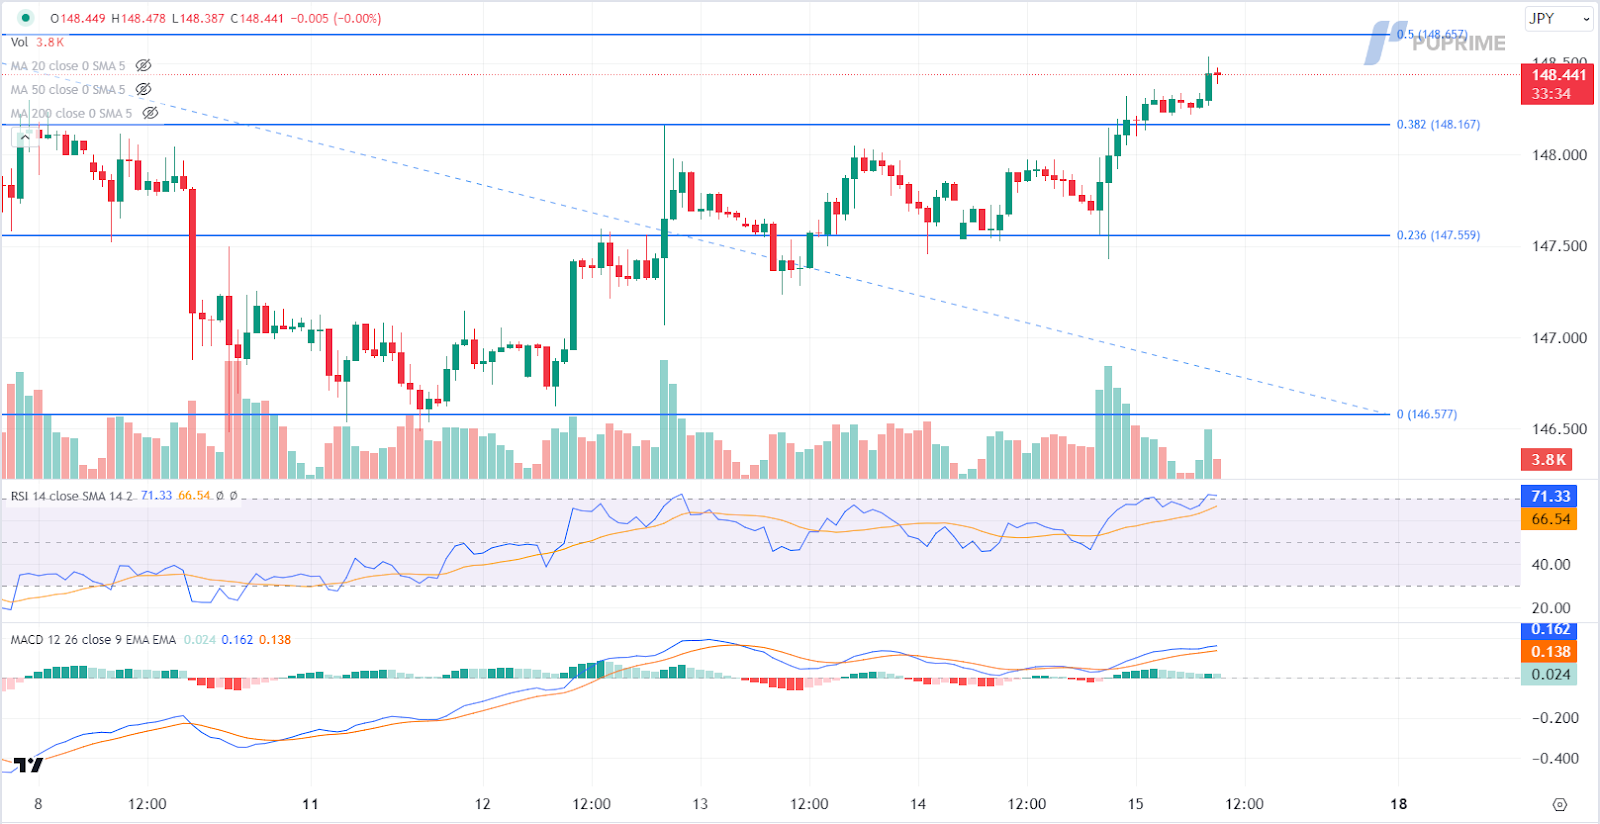
Speculation surrounding the Bank of Japan’s potential exit from negative rate policies dominated investor attention. A potential rate hike as early as next week’s March meeting led to a slight strengthening of the Japanese yen and a halt in the rally of Japanese equities. Economists anticipate the first-rate hike since 2007 to occur in April, pending evidence of meaningful wage increases.
USD/JPY is trading higher following the prior breakout above the previous resistance level. However, MACD has illustrated diminishing bullish momentum, while RSI is at 71, suggesting the pair might experience technical corrections since its entered overbought territory.
Resistance level: 148.65, 149.15
Support level: 148.15, 147.55
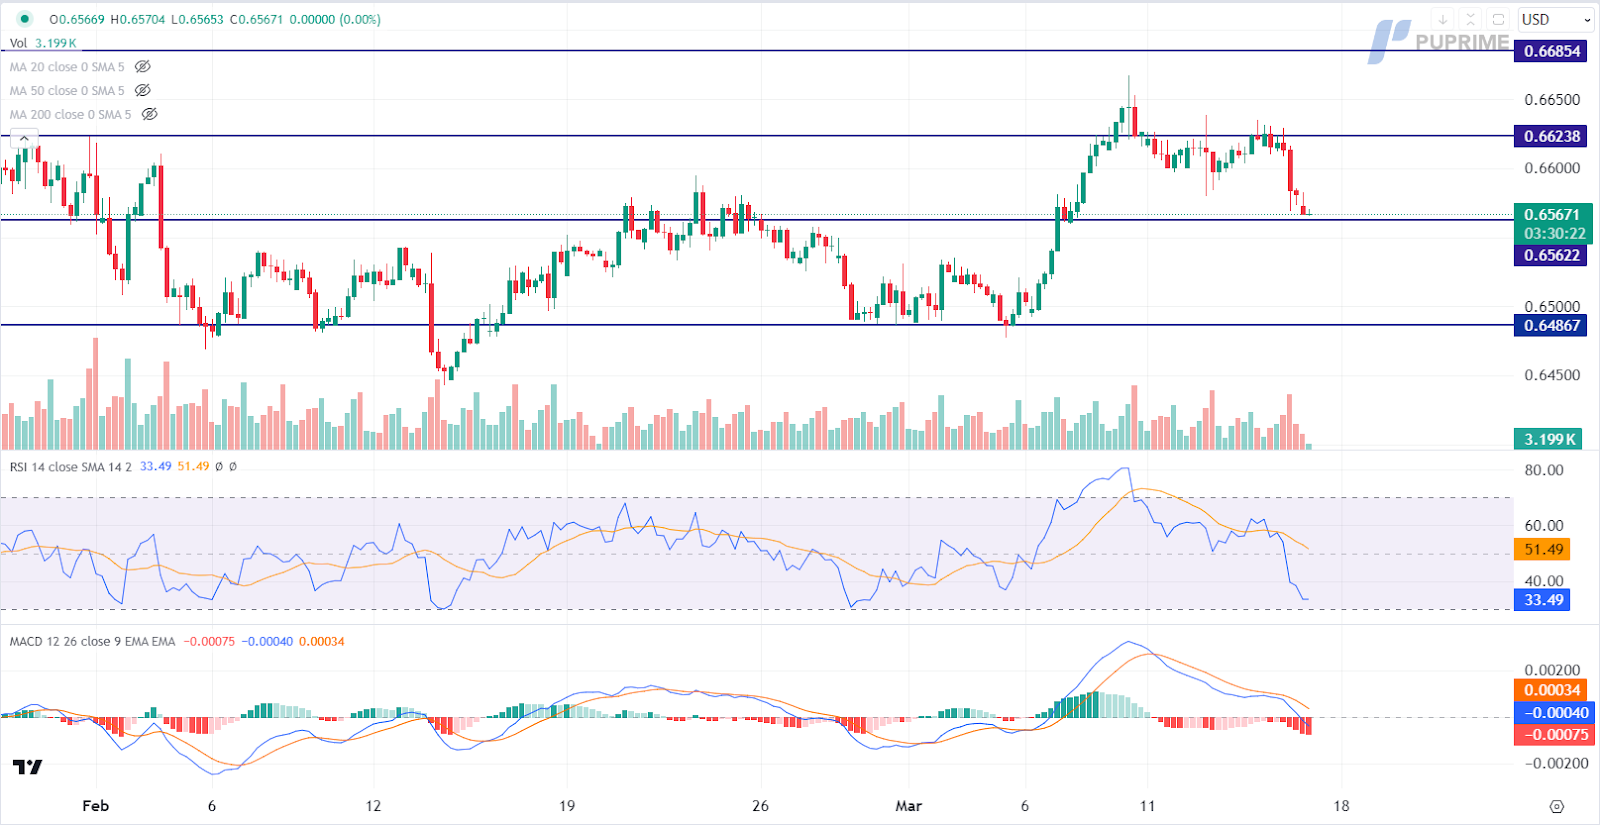
The AUD/USD pair experienced losses, breaking below crucial support levels as a sharp resurgence in demand for the US Dollar prevailed. Firm inflation data and positive labor market figures contributed to the Dollar’s recovery, alongside ongoing speculation regarding the Fed’s expected rate adjustments. Further catalysts for the Australian dollar are expected to hinge on China’s economic outlook.
AUD/USD is trading lower while currently testing the support level. MACD has illustrated increasing bearish momentum, while RSI is at 34, suggesting the pair might extend its losses after breakout since the RSI stays below the midline.
Resistance level: 0.6625, 0.6685
Support level: 0.6560, 0.6485
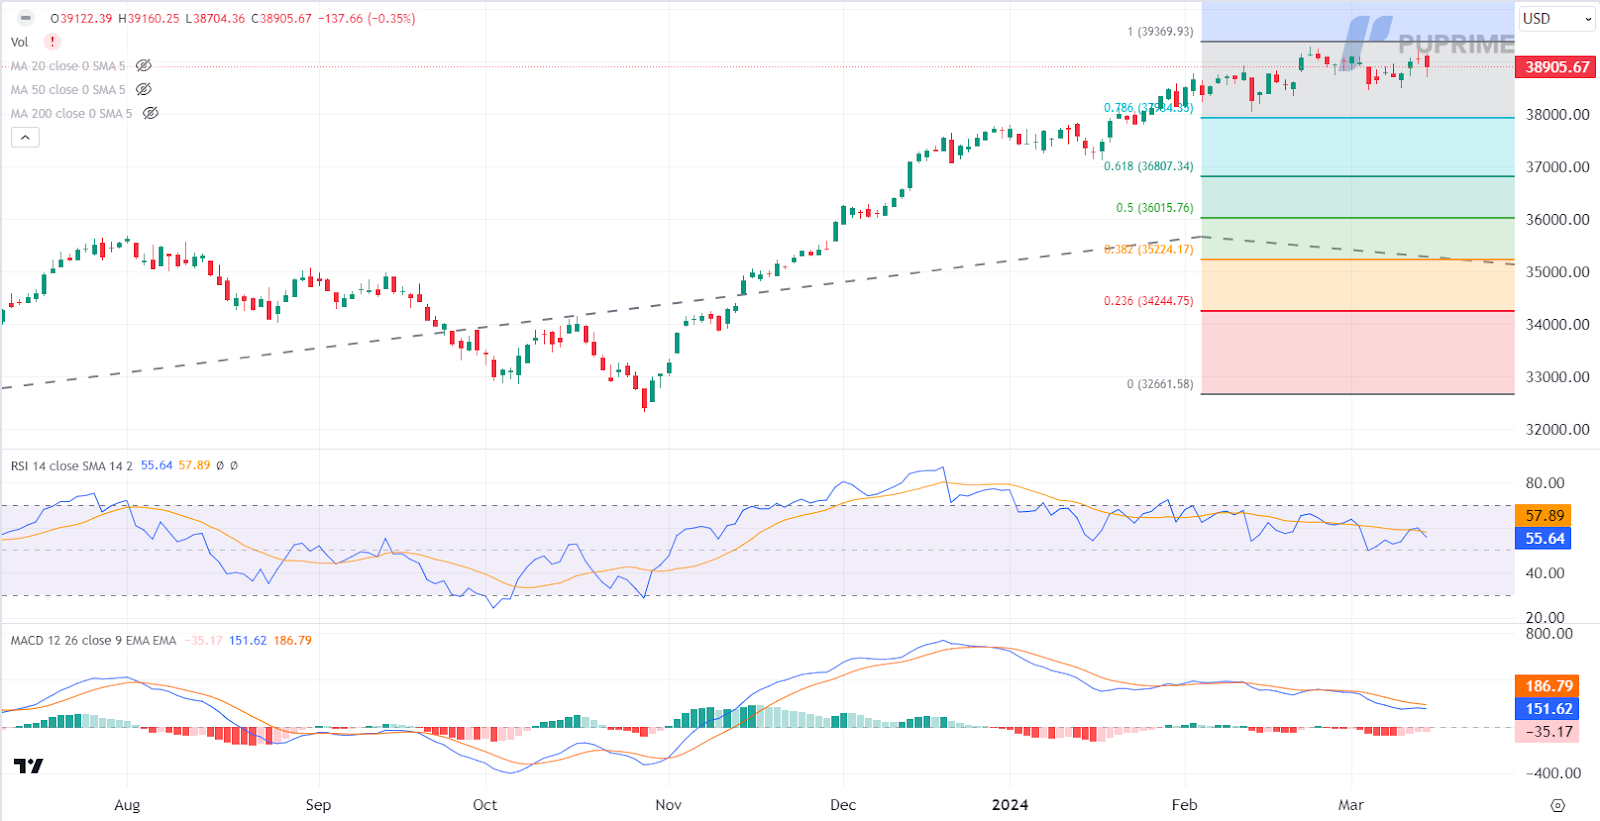
All three major US indexes experienced losses as surging bond yields, driven by hot inflation reports, diminished the appeal for equities. The benchmark 10-year Treasury yield climbed, leading investors to engage in profit-taking activities amid heightened expectations of high interest rates. Market participants awaited further clarity on equity movements from the Federal Reserve’s monetary policy decisions.
The Dow is trading lower following the prior retracement from the resistance level. However, MACD has illustrated diminishing bearish momentum, while RSI is at 56, suggesting the index might experience technical corrections since the RSI stays above the midline.
Resistance level: 39370.00, 40000.00
Support level: 37985.00, 36805.00
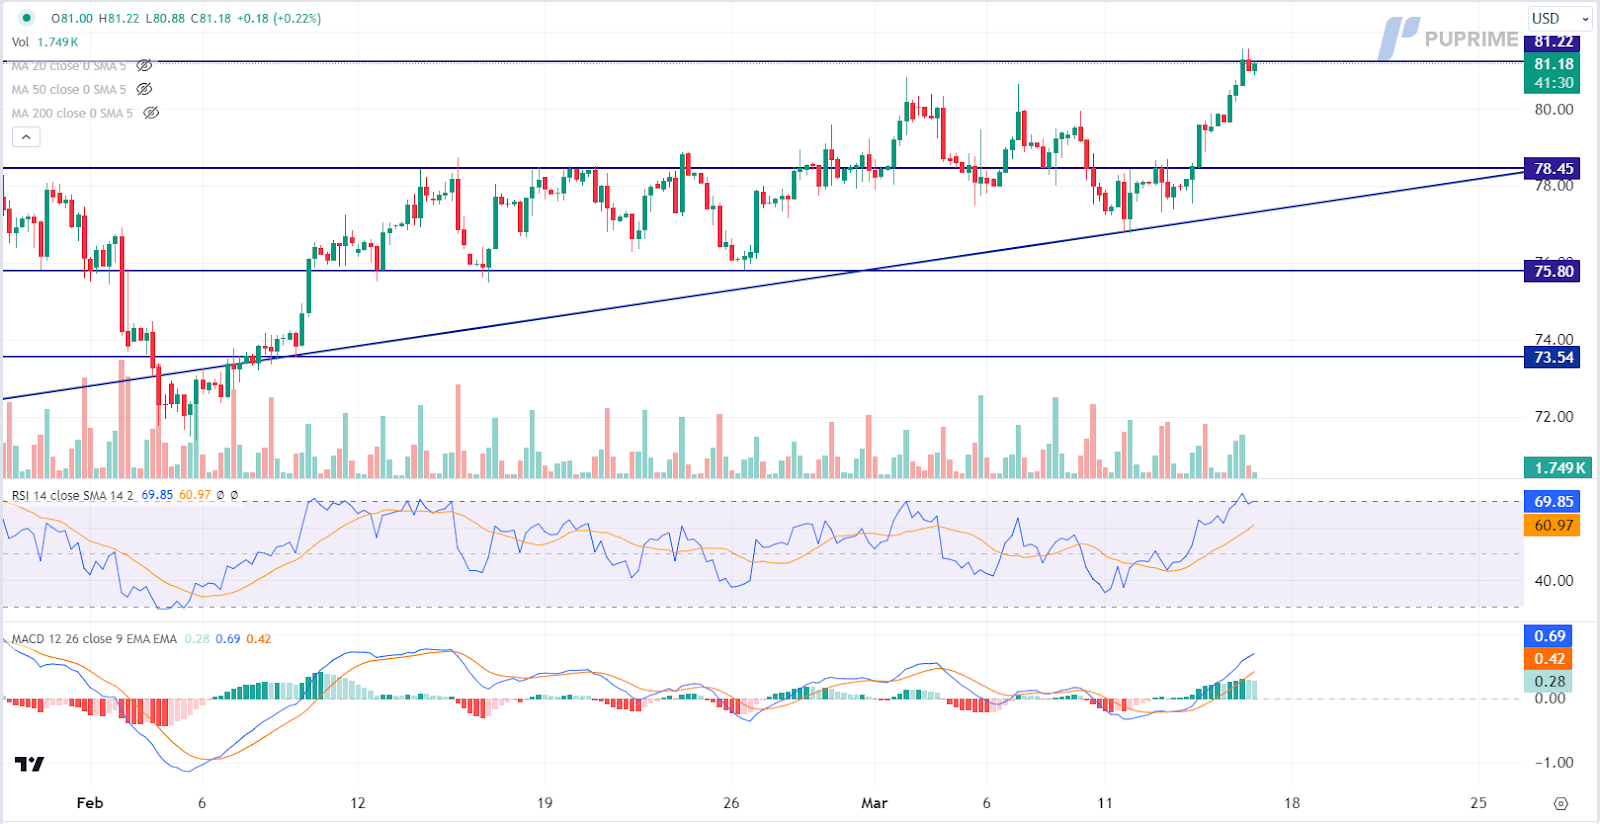
Crude oil prices continued their upward trajectory as the International Energy Agency projected a supply deficit for 2024. Improved economic performance, particularly in the United States, and increased bunkering contributed to a higher-than-expected rise in global oil demand. Meanwhile, world oil production is anticipated to decline due to weather-related shut-ins and OPEC+ curbs.
Oil prices are trading higher while currently testing the resistance level. However, MACD has illustrated diminishing bullish momentum, while RSI is at 70, suggesting the commodity might experience technical correction since the RSI entered the overbought territory.
Resistance level: 81.20, 85.45
Support level: 78.45, 75.80

Trade forex, indices, metal, and more at industry-low spreads and lightning-fast execution.
ہمارے پریشانی مفت عمل کے ساتھ PU پرائم لائیو اکاؤنٹ کے لئے سائن اپ کریں.
بغیر کسی تکلیف کے اپنے اکاؤنٹ کو وسیع چینلز اور قبول شدہ کرنسیوں کے ذریعے فنڈ کریں۔
مارکیٹ لیڈنگ ٹریڈنگ حالات کے تحت سینٹوں کی تعداد تک رسائی حاصل کریں.
پلتفرمهای معاملاتی
یادگیری
درباره PU Prime
شرکتی