


-
- پلتفرمهای معاملاتی
- اپلیکیشن PU Prime
- MetaTrader 5
- MetaTrader 4
- PU Copy Trading
- تاجر وب
- پی یو سوشل


FA
25 June 2025,02:11
Chart The Market
25 June 2025, 02:11


USDCHF, H4:
USD/CHF remains within a gradual recovery phase on the chart, consolidating just below the key resistance level at 0.8220 following a successful break above the descending trendline. Price action is currently supported above the reclaimed 0.8160 level, which had previously served as a neckline to a minor breakdown structure. Despite this rebound, price continues to encounter resistance near the upper bound of the recent range, limiting follow-through bullish momentum.
Momentum indicators are cautiously optimistic. The Relative Strength Index (RSI) has climbed to 58, maintaining its position above the neutral 50 mark, signaling a mild bullish bias. However, the indicator is beginning to flatten, suggesting that upward momentum may be slowing. Meanwhile, the MACD continues to show modest bullish divergence, with the MACD line marginally above the signal line and histogram bars printing in positive territory, though lacking strong expansion—implying a tentative uptrend rather than a decisive breakout.
From a structural standpoint, USD/CHF remains at a technical crossroads. A confirmed breakout above the 0.8220 resistance could signal the continuation of the recovery, with upside targets seen near 0.8400. However, repeated failure to breach this ceiling risks a retest of initial support at 0.8160, with a further pullback potentially exposing 0.8035. The pair’s ability to generate sustained buying interest above the neckline and trendline break will be key in determining whether this recovery can evolve into a more impulsive move higher.
Resistance Levels: 0.8220, 0.8400
Support Levels: 0.8160, 0.8035
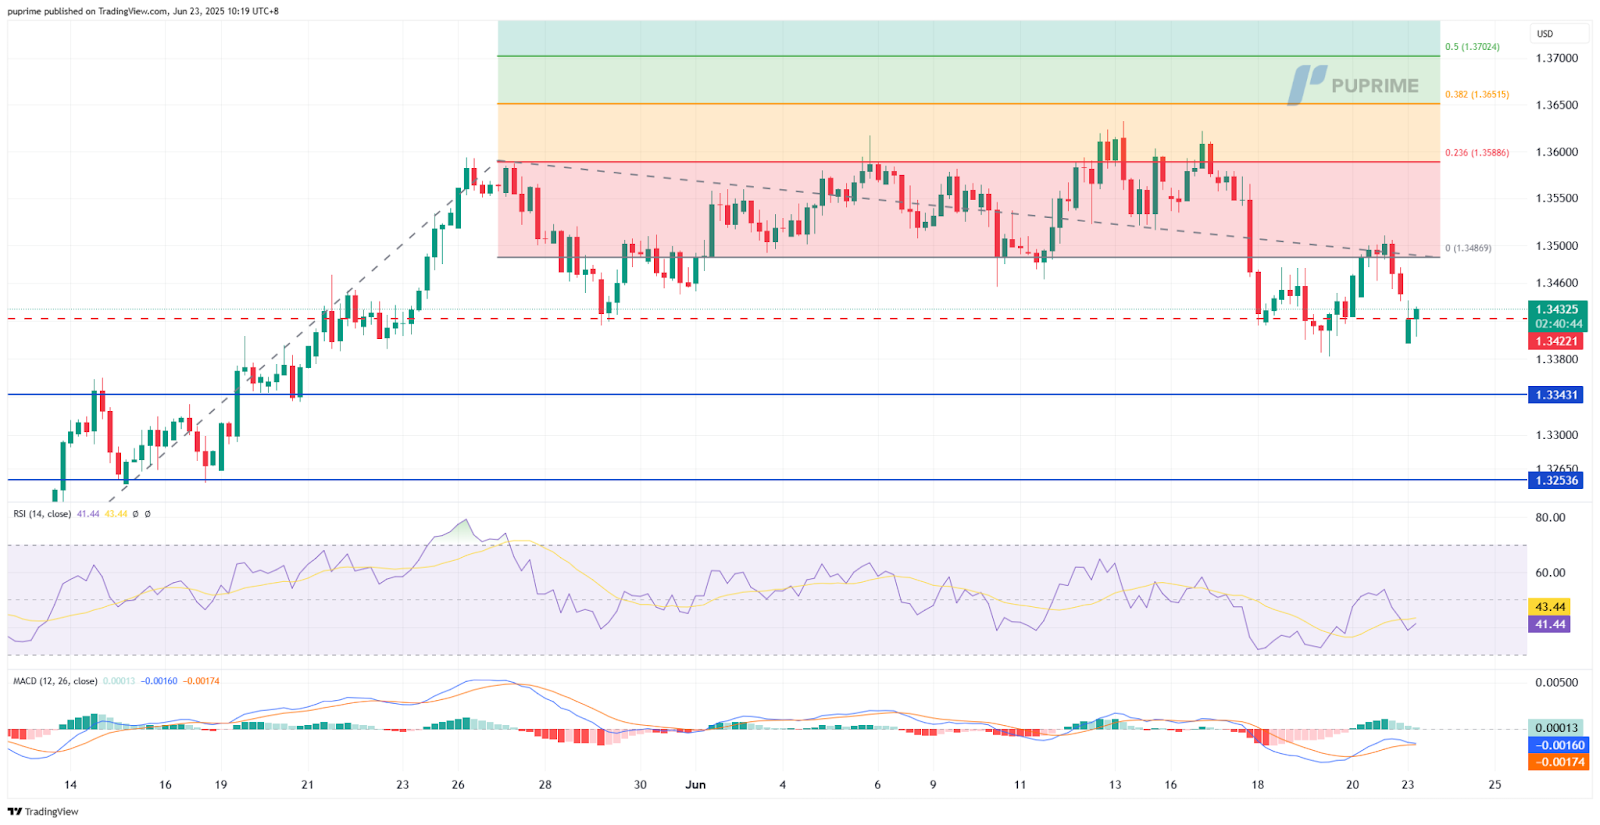
GBPUSD, H4
GBP/USD remains under pressure with price action slipping below the 1.3490 Fibonacci pivot after a failed attempt to reclaim the 23.6% retracement level at 1.3588. The pair now hovers near the 1.3420 region, testing a former demand zone that previously acted as a launchpad for bullish extensions. However, the recent lower high structure suggests a weakening bullish grip, with sellers increasingly asserting control.
Momentum indicators are painting a cautious picture. The Relative Strength Index (RSI) stands at 41, tracking just above the oversold boundary and reflecting a bearish bias with subdued recovery potential. The RSI’s failure to rebound above the 50 level signals a lack of strong buying conviction. Meanwhile, the MACD remains in bearish territory, with the MACD line positioned below the signal line and histogram bars still printing negative—although slightly contracting—suggesting a slowdown in downside momentum, not yet a reversal.
From a structural perspective, GBP/USD faces a pivotal moment. Sustained weakness below 1.3420 opens the door to deeper retracement levels, with support next resting at 1.3340 and further at 1.3255. Conversely, a recovery back above 1.3489 would be required to negate near-term bearish pressure and reinitiate upside interest, targeting 1.3588. Until then, downside risks remain in play amid fragile momentum and fading bullish follow-through.
Resistance Levels: 1.3490, 1.3588
Support Levels: 1.3420, 1.3340

Trade forex, indices, metal, and more at industry-low spreads and lightning-fast execution.
ہمارے پریشانی مفت عمل کے ساتھ PU پرائم لائیو اکاؤنٹ کے لئے سائن اپ کریں.
بغیر کسی تکلیف کے اپنے اکاؤنٹ کو وسیع چینلز اور قبول شدہ کرنسیوں کے ذریعے فنڈ کریں۔
مارکیٹ لیڈنگ ٹریڈنگ حالات کے تحت سینٹوں کی تعداد تک رسائی حاصل کریں.
پلتفرمهای معاملاتی
یادگیری
درباره PU Prime
شرکتی