-
- پلتفرمهای معاملاتی
- اپلیکیشن PU Prime
- MetaTrader 5
- MetaTrader 4
- PU Copy Trading
- تاجر وب
- پی یو سوشل


FA
4 September 2025,09:12
Chart The Market
4 September 2025, 09:12

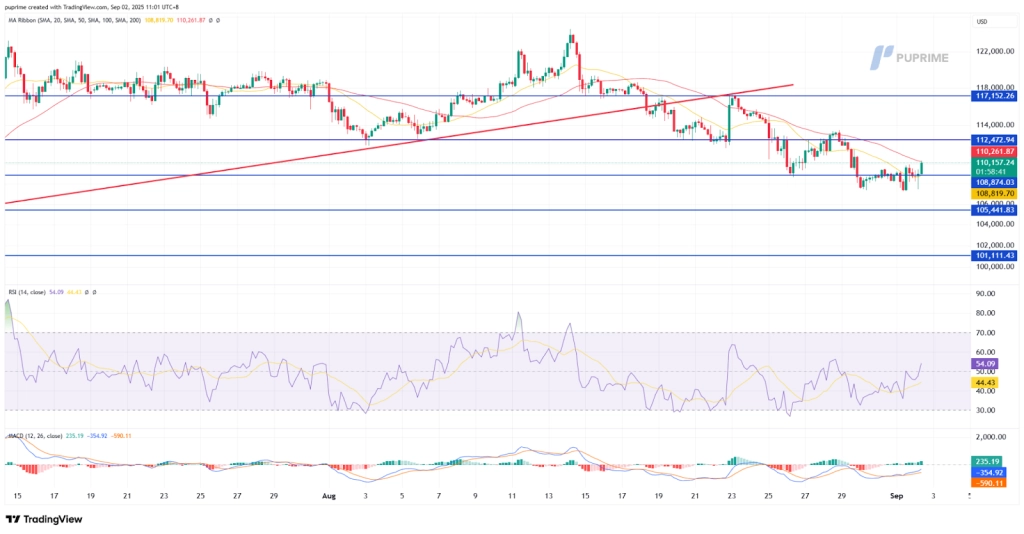
BTC, H4:
Bitcoin (BTC) remains under a descending channel formation, with price action capped by a series of lower highs and lower lows. The pair recently touched the $108,875 area before rebounding toward $112,470, yet upside attempts continue to stall beneath the channel’s upper boundary. This structure underscores that BTC is still trading within a corrective phase despite intermittent recovery efforts.
Momentum indicators are tilting constructively. The RSI is hovering around 55, holding above the midline and signaling buyers are gradually regaining control. Meanwhile, the MACD is flattening just below the zero line, with a potential bullish crossover emerging, suggesting upside pressure could be building.
Overall, BTC/USD holds a bearish-to-neutral bias as long as it stays confined within the descending channel. A decisive break above $112,470 would signal a potential trend shift toward $117,150, while failure to clear resistance risks renewed pressure back toward $108,875 and possibly $105,440.
Resistance Levels: 112,470.00, 117,150.00
Support Levels: 108,875.00, 105,440.00
USOIL, H4
USOIL has broken out of a descending channel formation, establishing a higher-low structure as prices stabilized above the $61.50 floor and reclaimed the $64.90 support level. The recovery has since extended toward the $65.15 handle, where price is testing resistance near the 23.6% Fibonacci retracement level, marking an early attempt at trend reversal.
Momentum indicators are tentative improvement. The RSI is holding above 64, suggesting buyers are regaining control without yet entering overbought territory, while the MACD remains in positive territory with a steady bullish crossover, signaling supportive momentum.
Overall, USOIL maintains a bullish-to-neutral bias above $64.00, with a sustained break above $65.15 needed to confirm upside extension toward $66.65 and $68.55. On the downside, a failure to clear resistance could trigger consolidation back toward $64.85 and $63.15 before fresh directional cues emerge.
Resistance Levels: 65.15, 66.65
Support Levels: 64.85, 63.15

Trade forex, indices, metal, and more at industry-low spreads and lightning-fast execution.
ہمارے پریشانی مفت عمل کے ساتھ PU پرائم لائیو اکاؤنٹ کے لئے سائن اپ کریں.
بغیر کسی تکلیف کے اپنے اکاؤنٹ کو وسیع چینلز اور قبول شدہ کرنسیوں کے ذریعے فنڈ کریں۔
مارکیٹ لیڈنگ ٹریڈنگ حالات کے تحت سینٹوں کی تعداد تک رسائی حاصل کریں.
پلتفرمهای معاملاتی
یادگیری
درباره PU Prime
شرکتی