


-
- پلتفرمهای معاملاتی
- اپلیکیشن PU Prime
- MetaTrader 5
- MetaTrader 4
- PU Copy Trading
- تاجر وب
- پی یو سوشل


FA
23 September 2025,06:46
Chart The Market
23 September 2025, 06:46


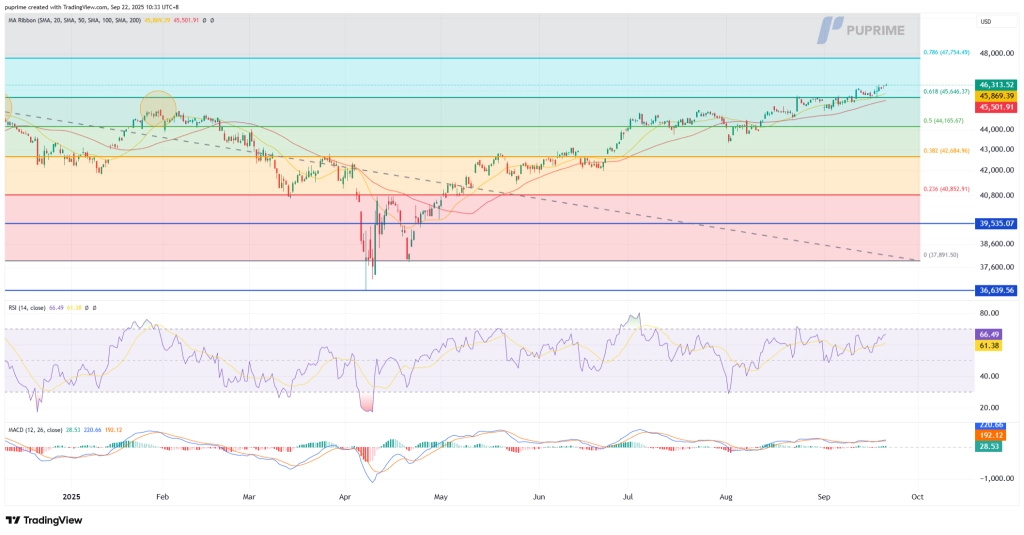
Dow Jones, H4:
The Dow Jones Index has extended its upward trajectory, reclaiming ground above the 45,650 Fibonacci zone and pushing toward the next key resistance at 47,750. This advance underscores the resilience of the broader uptrend, with the index steadily building on gains since the mid-year recovery. The ability to hold above the 45,500–45,700 region now serves as a pivotal confirmation of continued bullish momentum.
Price structure reflects a constructive outlook, with buyers maintaining control and higher lows reinforcing a supportive base for further upside. A decisive break above 47,750 would open the way toward fresh highs, while failure to breach this level could trigger short-term consolidation back toward 45,650 or 44,165.
Momentum indicators are leaning bullish: the RSI has climbed to 66, approaching overbought conditions but still showing healthy upside strength, while the MACD remains in positive territory, with its histogram expanding and signal lines trending upward, confirming sustained buying pressure.
Overall, the Dow maintains a strong bullish bias above 45,500, with scope for an extension toward 47,750 and potentially beyond if momentum persists.
Resistance Levels: 47,750.00, 50,400.00
Support Levels: 45,650.00, 44,165.00
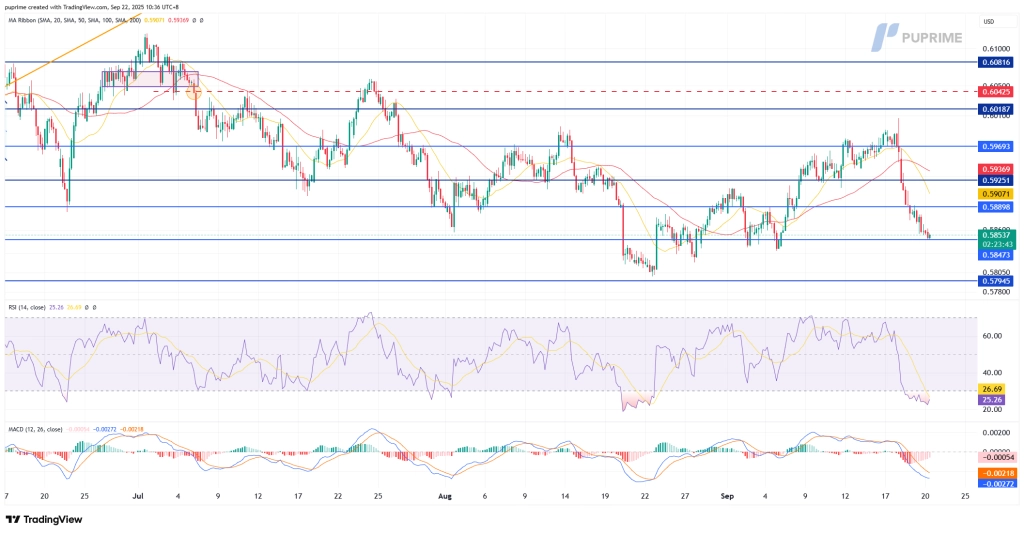
NZDUSD, H4
The NZD/USD pair has broken decisively below the $0.5890 support level, which had held as a critical floor through much of September, signaling a potential extension of its broader bearish trend. The pair has already shed more than 3% this month, with the latest breakdown reflecting renewed selling pressure and fading demand for the kiwi.
The breach of this support underscores strengthening downside conviction, leaving the pair vulnerable to further declines toward the next technical zone near $0.5795. Sustained weakness below $0.5890 could reinforce bearish control, shifting focus toward the $0.5795 level if momentum persists.
Momentum conditions align with the bearish bias: the RSI is hovering near 25, deep in oversold territory, highlighting strong downside pressure, while the MACD has extended further into negative territory, confirming accelerating bearish momentum.
In the near term, resistance now lies at the former support zone around $0.5890, with only a decisive recovery above this threshold likely to ease immediate bearish pressure. Until then, the path of least resistance remains lower.
Resistance Levels: 0.5890, 0.5925
Support Levels: 0.5850, 0.5795

Trade forex, indices, metal, and more at industry-low spreads and lightning-fast execution.
ہمارے پریشانی مفت عمل کے ساتھ PU پرائم لائیو اکاؤنٹ کے لئے سائن اپ کریں.
بغیر کسی تکلیف کے اپنے اکاؤنٹ کو وسیع چینلز اور قبول شدہ کرنسیوں کے ذریعے فنڈ کریں۔
مارکیٹ لیڈنگ ٹریڈنگ حالات کے تحت سینٹوں کی تعداد تک رسائی حاصل کریں.
پلتفرمهای معاملاتی
یادگیری
درباره PU Prime
شرکتی