


-
- پلتفرمهای معاملاتی
- اپلیکیشن PU Prime
- MetaTrader 5
- MetaTrader 4
- PU Copy Trading
- تاجر وب
- پی یو سوشل


FA
14 October 2025,06:04
Daily Market Analysis
14 October 2025, 06:04


*U.S. equities bounced sharply, with the Nasdaq surging 2.2% after last Friday’s heavy sell-off triggered by the U.S.–China trade tensions.
*Markets recovered as Trump’s softer weekend tone eased fears of a full-blown trade escalation, though volatility remains elevated.
*Persistent enthusiasm around artificial intelligence continues to provide underlying support for Wall Street’s broader resilience.
Market Summary:
U.S. equity markets staged a sharp recovery in the last session, with the Nasdaq Composite leading the advance by surging 2.2%, or 490 points. This rebound followed one of the worst single-day sell-offs in years last Friday, which saw the Nasdaq plummet 3.6% and the S&P 500 drop 2.7%.
The initial downturn was triggered by a significant escalation in trade tensions, following an unexpected announcement from former President Donald Trump threatening 100% tariffs on China. The deterioration was exacerbated by reports that China would retaliate by tightening export controls on rare earth minerals, which are critical for technology and electronics manufacturing. This move pressured major tech stocks, with giants like Nvidia, Apple, Tesla, and AMD falling between 3.5% and 5% on Friday.
The subsequent relief rally was fueled by a perceived softer tone from Trump on trade over the weekend, which eased immediate fears of a further escalation. Underpinning the market’s broader resilience is persistent bullish sentiment surrounding artificial intelligence, which has provided a foundation of support and helped buoy the sector.
The near-term outlook for Wall Street remains highly volatile and directly contingent on the trajectory of U.S.-China trade relations. Any resumption of trade talks would likely provide a positive catalyst for the market, while a further deterioration in the relationship is expected to prolong weakness and potentially trigger another leg down.
Technical Analysis
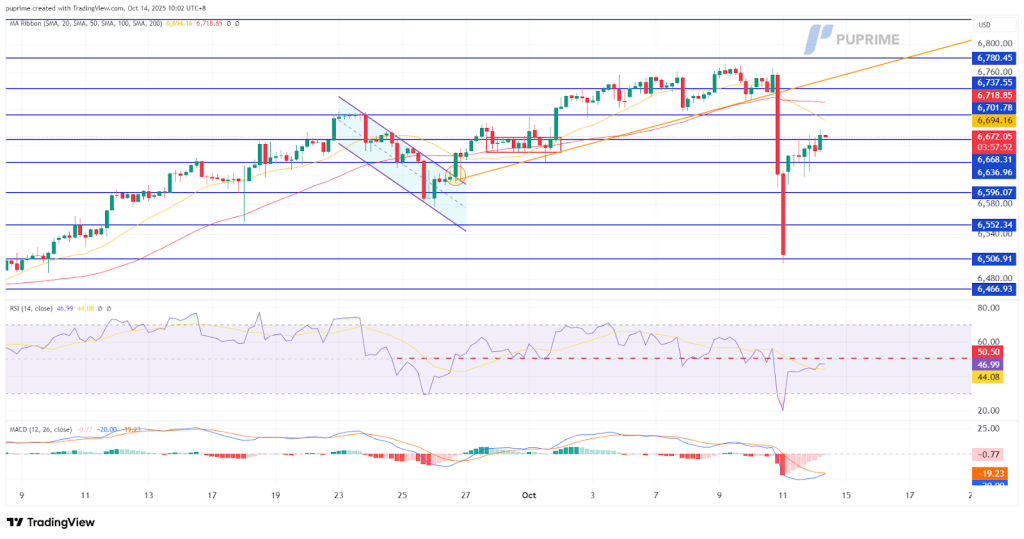
The S&P 500 is exhibiting signs of a potential trend reversal following a sharp prior decline that initially broke its previous bullish structure. The key technical development is the index’s robust recovery, which has now erased more than half of its earlier losses. Crucially, it has breached the significant Fibonacci retracement level of 61.8% at the 6660.00 mark. This breach suggests underlying buying strength and often precedes a resumption of the prior trend.
For a confirmed bullish reversal to be justified, the index must demonstrate an ability to consistently find support and sustain trading above the 6660.00 level in the upcoming sessions. A successful hold above this threshold would provide a stronger technical foundation for further upward movement.
However, this optimistic price action is challenged by lagging momentum indicators. The Relative Strength Index (RSI) remains below its mid-point, and the Moving Average Convergence Divergence (MACD) continues to trade below its zero line. Both oscillators indicate that bearish underlying momentum persists, creating a divergence with the price recovery. The near-term trajectory will be determined by whether price action can overcome this momentum deficit. A conclusive break above the next resistance level is needed to solidify the reversal and force a reset in momentum readings.
Resistance Levels: 6700.00, 6740.00
Support Levels: 6636.30, 6597.00

Trade forex, indices, metal, and more at industry-low spreads and lightning-fast execution.
ہمارے پریشانی مفت عمل کے ساتھ PU پرائم لائیو اکاؤنٹ کے لئے سائن اپ کریں.
بغیر کسی تکلیف کے اپنے اکاؤنٹ کو وسیع چینلز اور قبول شدہ کرنسیوں کے ذریعے فنڈ کریں۔
مارکیٹ لیڈنگ ٹریڈنگ حالات کے تحت سینٹوں کی تعداد تک رسائی حاصل کریں.
پلتفرمهای معاملاتی
یادگیری
درباره PU Prime
شرکتی