


-
- پلتفرمهای معاملاتی
- اپلیکیشن PU Prime
- MetaTrader 5
- MetaTrader 4
- PU Copy Trading
- تاجر وب
- پی یو سوشل


FA
14 October 2025,06:00
Daily Market Analysis
14 October 2025, 06:00


*AUD tumbled after President Trump announced a 100% tariff on Chinese imports and canceled a planned meeting with President Xi at the APEC summit.
*Beijing’s warning of countermeasures deepened market risk aversion, pressuring the China-linked Australian dollar.
*Traders now turn to RBA meeting minutes and upcoming employment data for insight into policy direction and labor market strength.
Market Summary:
The Japanese yen recovered late last week after suffering a sharp drop earlier, as renewed market The Australian dollar slumped on Friday after U.S. President Donald Trump unveiled plans to impose a 100% tariff on Chinese imports effective next month, while also canceling a scheduled meeting with Chinese President Xi Jinping at the upcoming APEC summit. The abrupt escalation revived fears of a deepening U.S.-China trade war, rattling global risk sentiment and pressuring currencies sensitive to Chinese economic activity.
Beijing swiftly rebuked the U.S., accusing it of “double standards” and signaling potential retaliatory actions, further souring ties between the world’s two largest economies. The Australian dollar, often seen as a barometer for China’s economic health due to Australia’s significant trade reliance on the Asian giant, bore the brunt of the renewed uncertainty.
Looking ahead, markets will scrutinize the Reserve Bank of Australia’s meeting minutes on Tuesday for insights into its monetary policy stance. Thursday’s labor market data will also be pivotal, offering clues on the domestic economy’s strength and the Australian dollar’s near-term path.
Technical Analysis
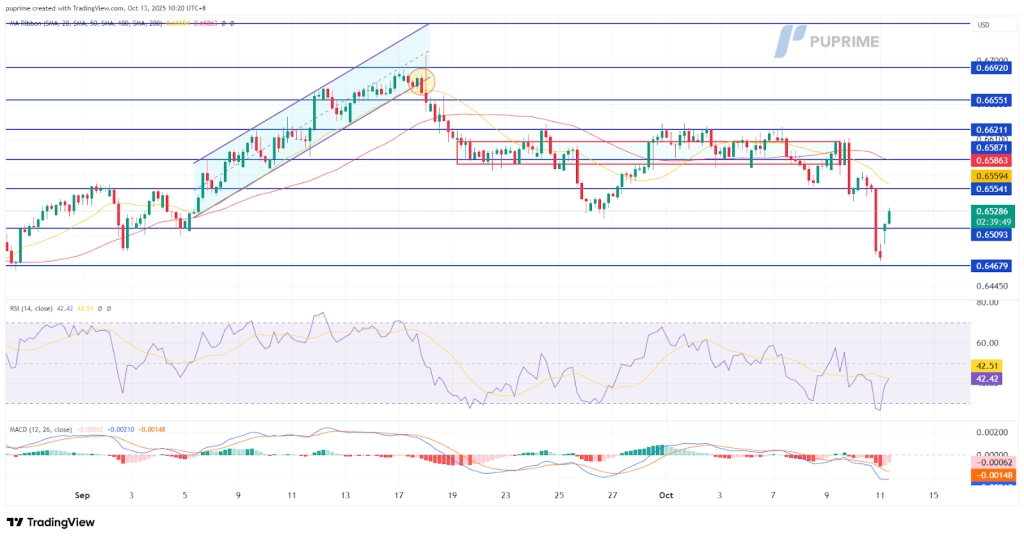
AUDUSD, H4:
The AUDUSD currency pair has extended its decline, breaching a significant technical support level and reinforcing a negative near-term outlook. The pair has depreciated to a two-month low of 0.6473, driven by sustained selling pressure and a critical breakdown of its previous consolidation zone.
The most salient technical development was the decisive break below the key support and liquidity zone situated near the 0.6530 level. This area had previously served as a floor for the pair, and its violation signals a critical shift in market structure from consolidation to a clear bearish trend. The breakdown suggests that underlying demand has been overwhelmed by supply, likely triggering stop-loss orders and inviting renewed short positioning, which has further justified the pair’s downward trajectory.
Momentum indicators corroborate the bearish price action. The Relative Strength Index (RSI) is now hovering near oversold territory, reflecting strong and persistent selling momentum. Concurrently, the Moving Average Convergence Divergence (MACD) histogram has edged lower following a confirmed break below its zero line. This alignment between the MACD signal and its zero line is a classic indicator that bearish momentum is not merely a short-term fluctuation but has become entrenched on a broader scale.
Resistance level: 0.6555, 0.6585
Support level: 0.6510, 0.6468

Trade forex, indices, metal, and more at industry-low spreads and lightning-fast execution.
ہمارے پریشانی مفت عمل کے ساتھ PU پرائم لائیو اکاؤنٹ کے لئے سائن اپ کریں.
بغیر کسی تکلیف کے اپنے اکاؤنٹ کو وسیع چینلز اور قبول شدہ کرنسیوں کے ذریعے فنڈ کریں۔
مارکیٹ لیڈنگ ٹریڈنگ حالات کے تحت سینٹوں کی تعداد تک رسائی حاصل کریں.
پلتفرمهای معاملاتی
یادگیری
درباره PU Prime
شرکتی