


-
- پلتفرمهای معاملاتی
- اپلیکیشن PU Prime
- PU Copy Trading
- PU Web Trader
- MetaTrader 5
- MetaTrader 4
- پی یو سوشل


FA
Published: 24 September 2025,07:25
Chart The Market


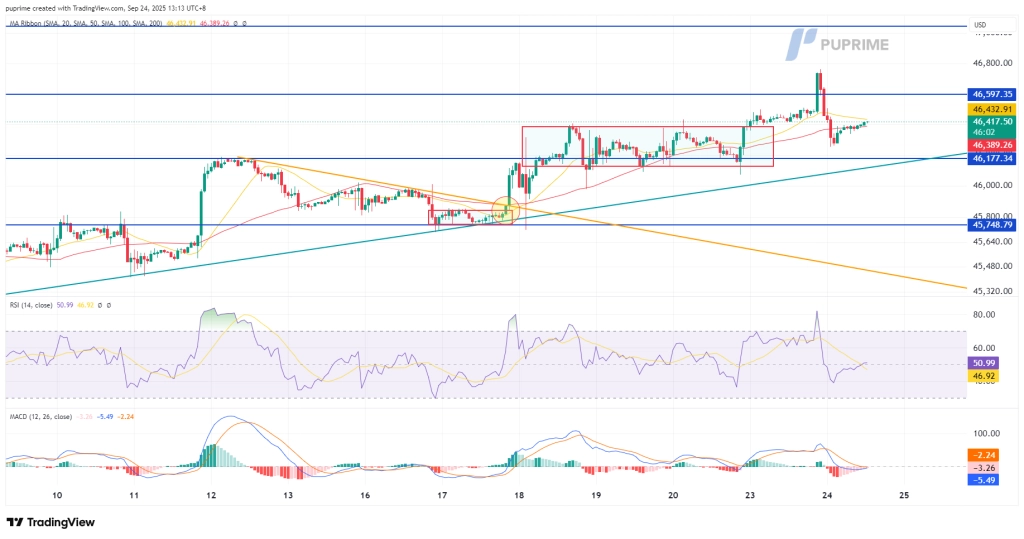
Dow Jones, H4:
The Dow Jones Industrial Average declined 1% in the previous session, retreating from its all-time high of 46,763 as investors engaged in profit-taking near peak levels. The sell-off pushed the index below its prior swing low, suggesting a near-term shift in momentum and raising the potential for a deeper corrective phase.
The index is now testing crucial support at the 46,130 level, which represents the lower boundary of its recent consolidation range. A sustained hold above this level would indicate that the broader bullish structure remains intact, while a breakdown could signal a more significant pullback toward the next support zone near 45,750.
Momentum indicators have turned notably weaker. The Relative Strength Index has declined below its midline, reflecting diminishing buying pressure, while the Moving Average Convergence Divergence is on the verge of crossing below its zero line—a development that would confirm deteriorating near-term momentum.
Resistance Levels: 46,600.00, 47,050.00
Support Levels: 46,150.00, 45,750.00
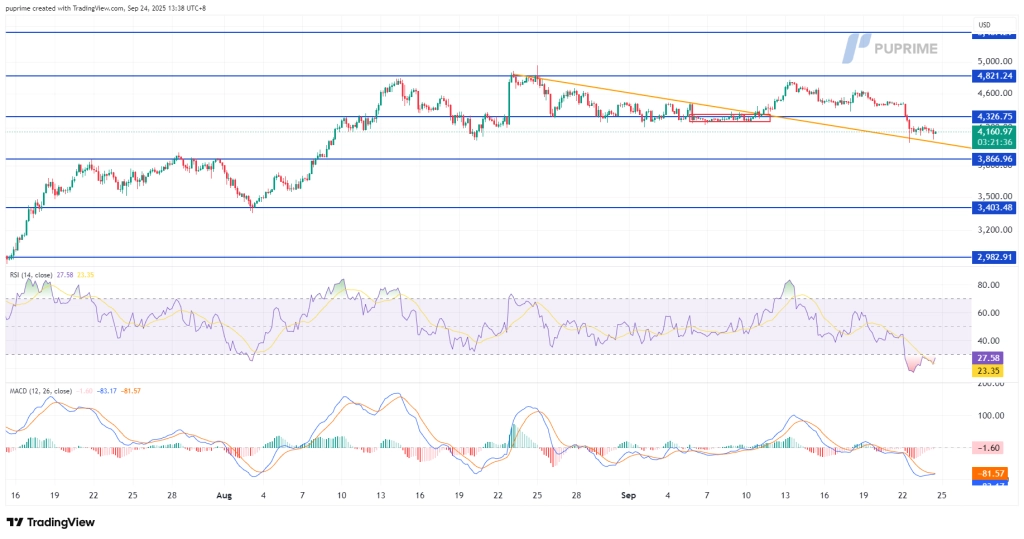
ETH, H4
Ethereum has decisively broken its bullish technical structure, declining more than 10% early in the week and falling below the critical liquidity zone near $4,300. The breakdown confirms a shift to a bearish near-term bias, with the cryptocurrency now trading in a sideways pattern as it consolidates following the sharp sell-off.
A break below the current consolidation range would reinforce the negative outlook and potentially trigger a deeper correction toward the next significant support level near $4,000. The move reflects a combination of factors, including broad-based profit-taking in digital assets, unwinding of overleveraged long positions, and deteriorating short-term momentum.
Momentum indicators are aligned with the bearish price action. The Relative Strength Index has entered oversold territory, indicating intense selling pressure, while the Moving Average Convergence Divergence has crossed below its zero line and continues to trend lower, confirming that downward momentum is accelerating.
Resistance Levels: 4326.00, 4821.00
Support Levels: 3867.00, 3403.00

Trade forex, indices, metal, and more at industry-low spreads and lightning-fast execution.
ہمارے پریشانی مفت عمل کے ساتھ PU پرائم لائیو اکاؤنٹ کے لئے سائن اپ کریں.
بغیر کسی تکلیف کے اپنے اکاؤنٹ کو وسیع چینلز اور قبول شدہ کرنسیوں کے ذریعے فنڈ کریں۔
مارکیٹ لیڈنگ ٹریڈنگ حالات کے تحت سینٹوں کی تعداد تک رسائی حاصل کریں.
پلتفرمهای معاملاتی
یادگیری
درباره PU Prime
شرکتی
